MBS Weekly Market Commentary Week Ending 4/5/19

Treasury yields ended the week higher, although the 10-year yield managed to close below 2.50%.

*The MBS Weekly Market Profile Report corresponds to the commentary below.*

Treasury yields ended the week higher, although the 10-year yield managed to close below 2.50%. The yield curve maintained its conspicuous “bowed” shape, with yields on the 3- and 5-year notes below that of the 2-year, leaving the 2-5yr spread slight inverted (-3.5 basis points) while the 2-5-10 butterfly decreased by another 2.5 bps to end at -22.5 bps. The Fed Funds futures market has scaled back its expectations for a Fed rate cut by the beginning of 2020. According to Bloomberg, the markets are currently projecting a 58% probability of an easing by the January 29th meeting, as opposed to a 75% probability forecast at the end of last month. (Of course, this contrasts with the 45% probability of a rate increase by September of this year that was forecast after the December OMC meeting.)

MBS spreads were mixed on the week, with 30-year Fannie and Ginnie II current coupon spreads tightening by 2 basis points versus interpolated Treasuries while 15-years widened by 3 bps versus the 5-year yield. The most important development in the MBS market for originators was the Fannie 3 roll, which blew out to 6.75 ticks (7/32nds on Bloomberg) or more than 5+ special. The roll market dislocation reflected both hedging of issuance in the back months (May and June) as well as uncertainty over how much older issuance is available for delivery against April purchases. (The roll has eased this morning in front of today’s Class A notification deadline, and is currently offered at 5 ¾ ticks. It’s also notable that the GNII 3% roll remains within a plus of its break-even level.)

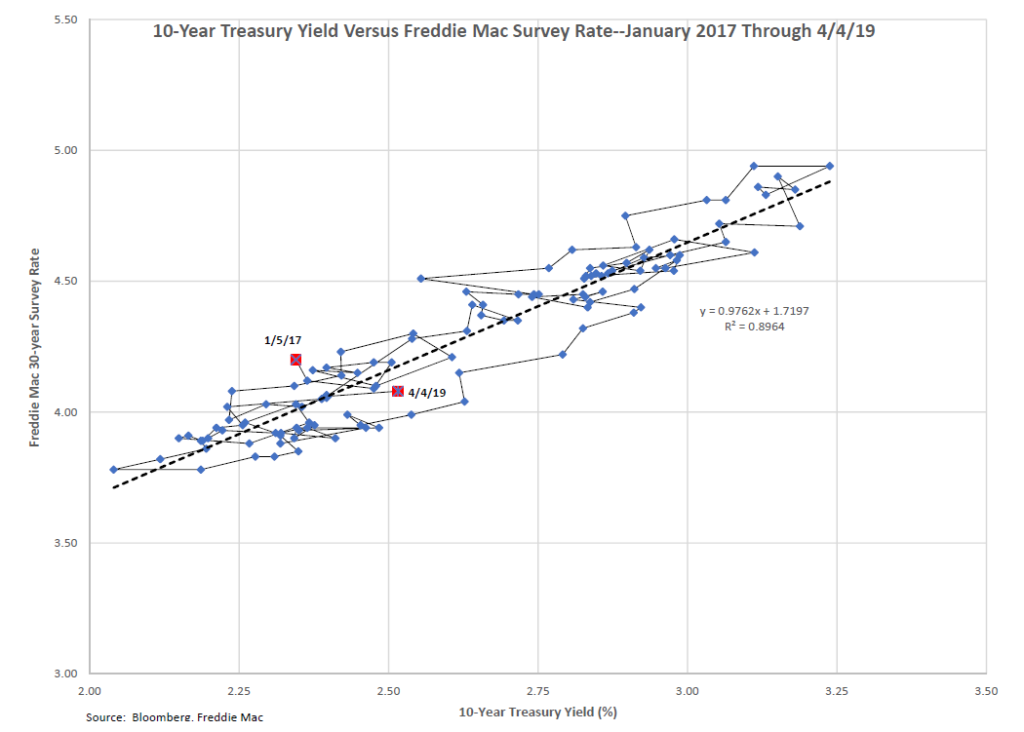
With the Freddie Mac survey rate printing at 4.08%, primary mortgage rates remain at their lowest level since January 2018. The last time the survey rate was in this area was the week of 1/18/18, when it reported at 4.04%. The accompanying chart, which shows the survey rate plotted versus the 10-year Treasury yield, indicates that mortgage rates are roughly in line with their level relative to Treasuries over the past 2+ years.

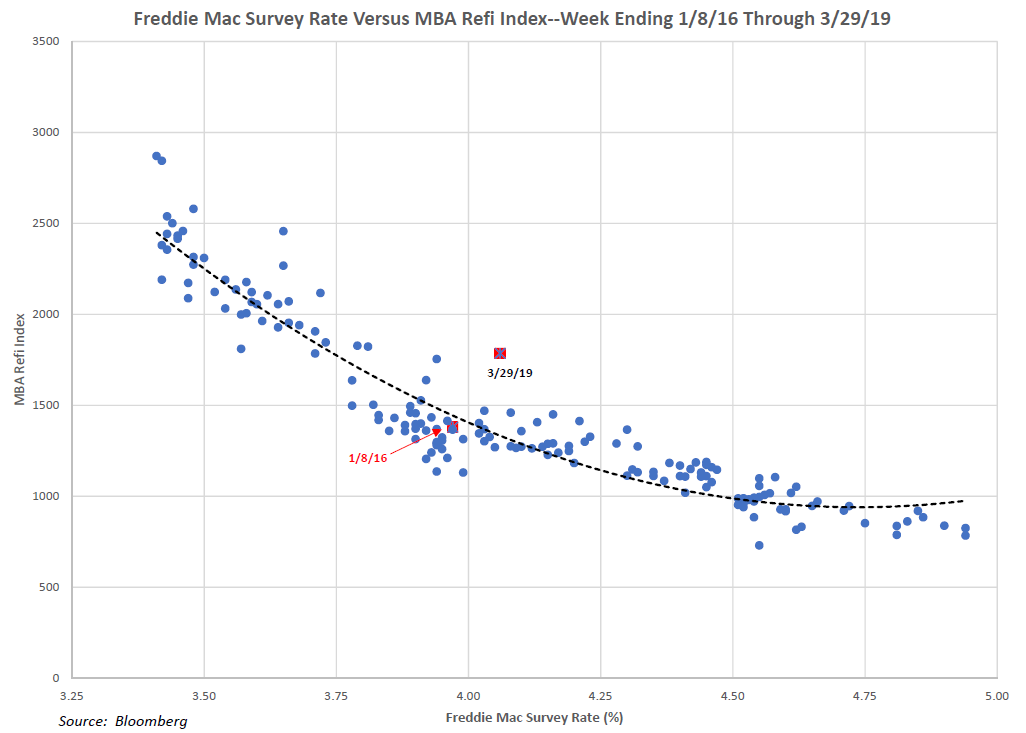
By contrast, last week’s MBA refi index was well in excess of expectations. The refi index reported at 1786, its highest level since November of 2016 and 53% higher than its average over the prior four weeks. While we expected refi activity to increase as mortgage rates approached 4%, last week’s refi index was well above the fitted value relative to the Freddie survey rate over the past 3+ years, as indicated in the chart below. (The regression implied a print of 1310, more than 25% below last week’s report.)

It’s unclear whether the spike in refi applications represented a short-term aberration resulting from the convergence of low rates and seasonal factors. Alternatively, it could indicate pent-up refi demand for refis stoked by 2 ½ years of high rates combined with gains in home prices, facilitating a surge in both rate-and-term and cash-out refinancings. A sustained increase in refi activity and overall applications, while welcome, will serve to dampen some of the enthusiasm for alternative mortgage sectors such as jumbo and non-QM lending.

About the Author: Bill Berliner

As Director of Analytics, Bill Berliner is tasked with developing new products and services, enhancing existing solutions, and helping to expand MCT’s footprint as the preeminent industry-leader in secondary marketing capabilities for lenders.

Mr. Berliner boasts more than 30 years of experience in a variety of areas within secondary marketing. He is a seasoned financial professional with extensive knowledge working with fixed income trading and structuring, research and analysis, risk management, and esoteric asset valuation.

Mr. Berliner has also written extensively on mortgages, MBS, and the capital markets. He is the co-author, with Frank Fabozzi and Anand Bhattacharya, of Mortgage-Backed Securities: Products, Structuring, and Analytical Techniques, which was named one of the top ten finance texts in 2007 by RiskBooks. He wrote and edited chapters for The Handbook of Mortgage-Backed Securities, The Handbook of Fixed-Income Securities, Securities Finance, and The Encyclopedia of Financial Models. In addition, Mr. Berliner co-authored papers published in The Journal of Structured Finance and American Securitization. He also wrote the monthly “In My View” column for Asset Securitization Report from 2008-2012.

10-Year Treasury Yield Curve

Compare this chart with the mortgage rates chart to see how the 10-year treasury and mortgage rates are correlated. Read more below to learn how mortgage rates are tied to the 10 year treasury yield. View raw data on U.S. Department of the Treasury website.


Mortgage Rates Today

The current MBS daily rates are shown below in this chart for 5/1 Yr ARM, Jumbo 30 Yr, FHA 30 Yr, 15 Yr Fixed, 30 Yr Fixed. Sign up for our MBS Market Commentary to receive daily mortgage news in your inbox.

About the Author

Robbie Chrisman, Head of Content, MCT

Robbie started his mortgage industry career with internships during high school and college at Peoples National Bank in Colorado, and RPM & Bay Equity in the San Francisco Bay Area. After graduating from The University of Texas at Austin with a degree in Finance in 2014, he went to work at SoFi, where he rose to Director, Capital Markets assisting in the creation of SoFi’s residential mortgage division before leaving to work for TMS in Austin, Texas. From there, he went to work for FinTech startup Riivos in San Francisco and now is the Head of Content at Mortgage Capital Trading (MCT) in San Diego.

 Join Newsletter or Follow MCT on Social Media:

Previous Weekly Market Reviews by Mortgage Capital Trading (MCT)

Sign up for daily mbs market commentary and review previous commentaries by visiting our commentary category page. Join our email list for further MBS market news, subscribe to receive educational articles, whitepapers, relevant updates, and mortgage market commentary. 

MBS Weekly Market Commentary Week Ending 3/31/23

The market reaction went a little “too far, too fast” in regard to the Fed policy pivot. We witnessed the coupon stack (i.e., the price spread between TBA coupons) decompress in more than a trivial manner in a short period. However, the primary mortgage market has been largely reluctant to follow the Treasury rally, and mortgage rates have ultimately not dropped by the same amount as Treasury yields.

MBS Weekly Market Commentary Week Ending 3/24/23

The FOMC raised its benchmark rate by 25 basis points to a new range of 4.75%-5.00% on Wednesday, a middle ground policy move made in the hope of tampering inflation without further harming the banking system. The raise marks the 9th consecutive rate hike since the Fed began hiking in May of last year and brings the target fed funds rate range to the highest level since September 2007. While the central bank’s monetary policy has been aimed at correcting inflation, it has also revealed hidden weaknesses (e.g., entities whose balance sheets relied on low interest rates).

MBS Weekly Market Commentary Week Ending 3/17/23

Next week will reveal the Fed’s resolve on continuing to beat the drum on their aggressive inflation fight. The word until now has been that the central bank will keep hiking interest rates until inflation is under control.

MBS Weekly Market Commentary Week Ending 3/10/23

Events this week likely will lead to a higher peak interest rate than investors had been expecting just weeks ago. Central bankers appear worried about a cycle in which workers seek higher pay to offset inflation’s bite, and in turn trigger more price increases. In fact, inflation remains high because people have jobs and earn enough income to cover stubbornly expensive housing costs. Robust hiring is good for the economy and workers, but elevated pay growth puts added pressure on the Fed to bring down earnings. 

MBS Weekly Market Commentary Week Ending 2/10/23

The week after the jobs report is generally pretty data-light, and this week was no exception. With a dearth of data, market movement hinged on “Fed speak” and consumer sentiment. We saw some volatility return to bond markets as investors built in expectations for a more hawkish Fed. As a reminder, the Fed raised its benchmark rate last week to a range of 4.5% to 4.75%. Let’s run through what we’ve learned in the wake of that decision and a robust U.S. payrolls report that took some wind out of investors’ sails that had hopes for rate cuts by summer.

MBS Weekly Market Commentary Week Ending 2/3/23

As strong as economists may have thought the job market was, it’s even stronger. In addition to headline non-farm payrolls in January (517,000) beating estimates by around 300,000, employment numbers were revised higher for the past two months. Yes, a tight labor market is anathema to any sort of quick stop to the Federal Reserve’s rate hiking cycle, but the growth rate in average hourly earnings is declining, which will be welcome news to Fed Chair Powell and his colleagues. There exists a raging debate among economists over whether we’ll need a sharp rise in unemployment to keep inflation low.