Live Mortgage Indices
MCT’s mortgage indices are based on actual locked loans, not applications, and are therefore a precise indication of both industry lock volume and locked note rates. MCT-collected statistics are unique to the industry, given the diversity of lender sizes, products, and business models across our national footprint.
Add These Indices to Your Site
Select the index you want to show, then copy the embed code into any page. All embeds reflect purchase, owner-occupied loans over the last 10 snapshot days. The Lock Volume Index reflects the last 30 days.
Mortgage Indices Methodology
The MCT Rate Lock Index draws on real, executed rate locks, not survey responses or rate-sheet quotes.
Data Sources
The mortgage index draws on note-rate locks submitted through MCTlive!®, MCT's cloud-based hedging and loan sales platform, across retail, wholesale, correspondent, and consumer direct channels.
Calculation Methodology
Each business day, MCT aggregates locked note rates by loan program, conventional, FHA, VA, and USDA, across a range of amortization terms and computes a loan amount weighted average across all qualifying locks. While a day's locks are still accumulating, the reading is volume-blended with the prior business day's final value: the index opens near yesterday's close and settles on the day's own average as volume builds, so intraday moves reflect genuine rate changes rather than the makeup of the morning's earliest locks. Builder and non-builder lending are tracked as separate series.
Sample Size & Coverage
The index draws on daily lock activity from 300+ mortgage bankers, banks, and credit unions originating across all 50 states.
Update Cadence
Index values update throughout each business day as new locks are recorded, and each day's reading is finalized at the close of business. Weekends and holidays carry the most recent trading day forward, and trend charts and high/low ranges are computed from completed days only.
Disclaimers
Index values are provided for informational purposes only. They are not a rate quote, an offer to extend credit, or investment, pricing or hedging advice. Values reflect market-wide averages and may not correspond to the pricing available on any individual loan. Contact MCT's capital markets team for loan-level or portfolio-specific pricing.
Lock Volume Index
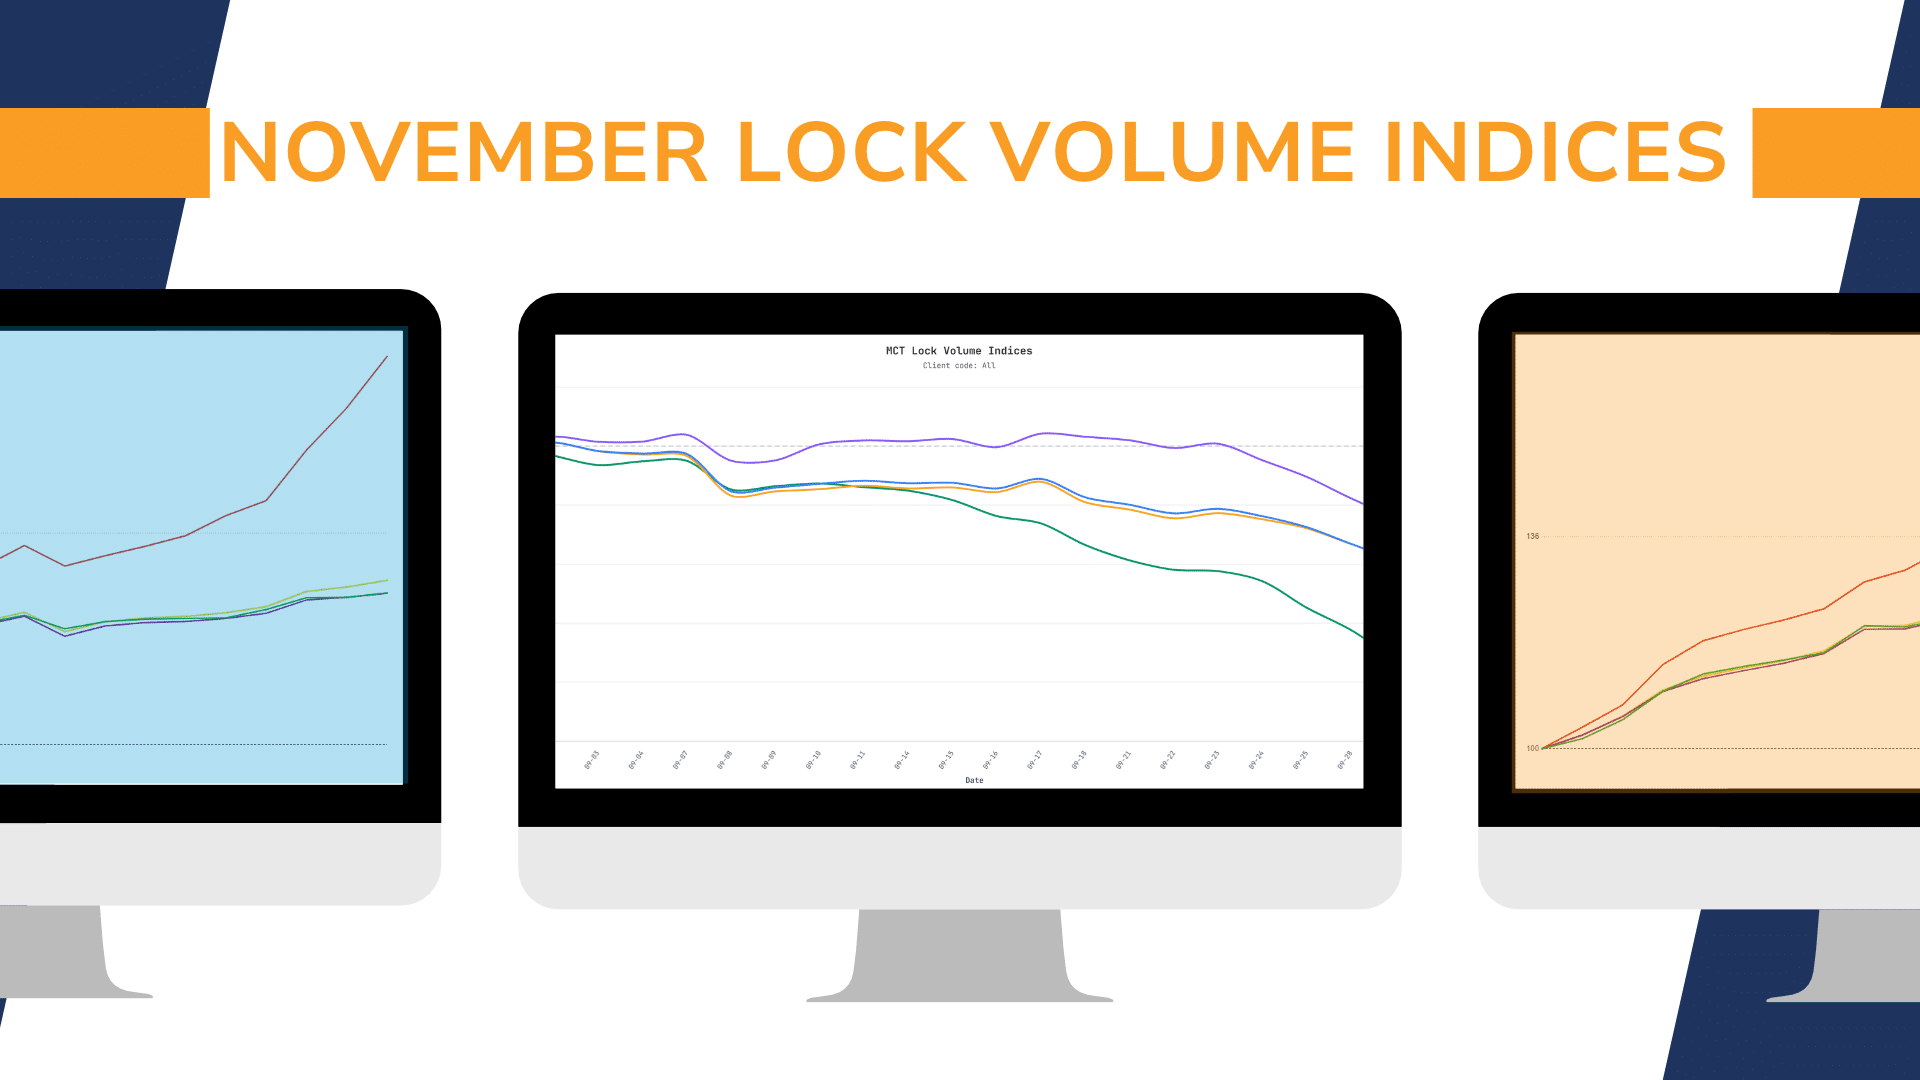
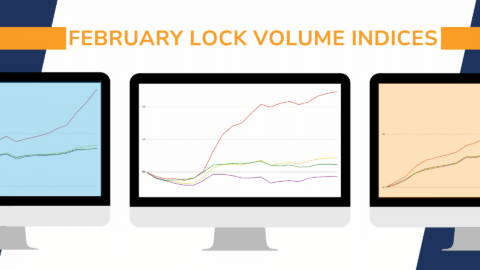
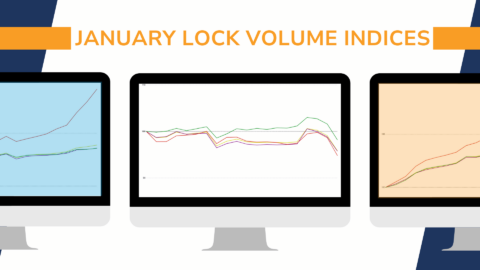
MCT’s Lock Volume Index presents a snapshot of rate lock volume activity in the residential mortgage industry broken out by lock type (purchase, rate/term refinance, and cash out refinance) across a broad diversity of lenders (e.g., sizes, products/services offered, business models) from MCT’s national footprint.
Turn Lock and Pipeline Data Into a Competitive Edge
Lender Analytics helps lenders benchmark performance, monitor market share, and build custom reporting on the same data that powers this index.
Lock Volume Indices Reports