MBS Weekly Market Commentary Week Ending 4/18/19

Treasury yields moved in a narrow band last week, with intermediates maturities lagging both the short and long end of the curve. The reshuffling of the curve left the 2-5 spread inverted by less than a basis point, while the 2-10 year spread moved wider by roughly 4 basis points.

*The MBS Weekly Market Profile Report corresponds to the commentary below.*

The MBS market generally lagged Treasuries last week. The 30-year Fannie and Ginnie Mae current coupon spreads over interpolated Treasuries widened by about 7 basis points on the week, while the 15-year Fannie current coupon was about 3 wider versus the 5-year yield. Dollar rolls remain well-behaved, with only lower coupons (30-year 3s, 15-year 2.5s) rolling modestly special. The uptick in rates was accompanied by some expanding of coupon swaps, leaving for example the Fannie and Ginnie II 4/3.5 swaps wider by 7 and 8 ticks, respectively.

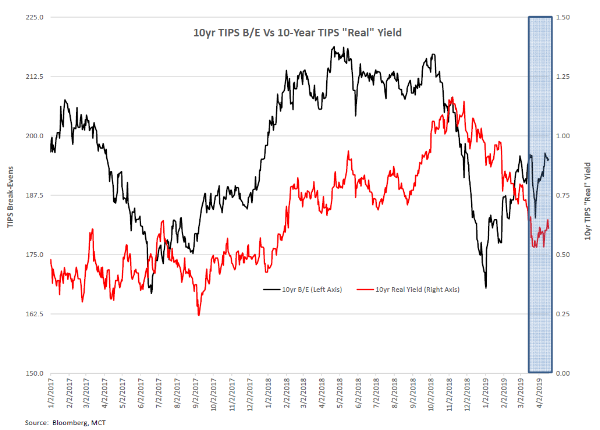
A brief examination of historical 10-year Treasury yields gives an interesting perspective on the market’s implicit outlook. The chart below shows that since bottoming out in late March, the yield on the 10-year note has drifted higher, although it remains basically in the middle of bands that delineate 2 standard deviations of price movements, using a 40-day lookback. (These are sometimes referenced as Bollinger bands and often used by technical analysts as a forecasting tool.)

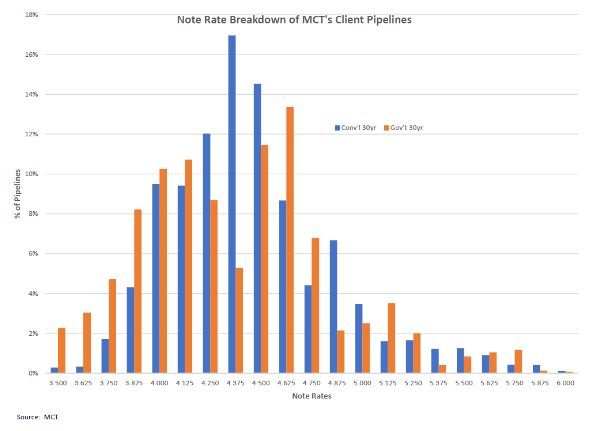
Client pipelines for 30-year conventional and government loans are displaying some interesting differences. The distribution of note rates (by balance) for 30-year conventional and government loans is shown in the chart below, and the different shape of the distributions is quite noticeable—while the note rates for conventional loans appear to be distributed normally (i.e., the “bell curve”), the government pipeline has large amounts of locks both above and below the central rates. (For example, while 6% of the locks by loan count in the 30-year conventional pipelines have rates below 4%, approximately 16% of conventional locks have similarly low rates.)

Loan balances for the two pipelines are also noticeably different and reflected in differences between the arithmetic mean rates and the weighted average rates for the two products. The weighted average rate for 30-year conventional and government rates is 4.48% and 4.36%, respectively, while the mean rates are 4.49% and 4.43%. The difference between the mean and weighted average rate in the government pipelines is, interestingly, attributable to a population of low-rate government loans with unusually large balances. The accompanying chart shows the average balance by note rate for the two products, and it indicates that the balances of government loans with note rates below 4% are noticeably larger than for conventional products.

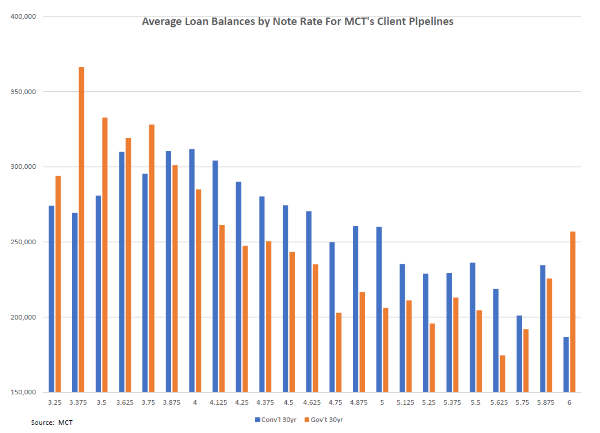
It’s unclear why so many large low-rate government loans are being locked, but if it represents an industry trend it could impact coupon swaps and dollar rolls for lower-coupon Ginnie Maes.

About the Author: Bill Berliner

As Director of Analytics, Bill Berliner is tasked with developing new products and services, enhancing existing solutions, and helping to expand MCT’s footprint as the preeminent industry-leader in secondary marketing capabilities for lenders.

Mr. Berliner boasts more than 30 years of experience in a variety of areas within secondary marketing. He is a seasoned financial professional with extensive knowledge working with fixed income trading and structuring, research and analysis, risk management, and esoteric asset valuation.

Mr. Berliner has also written extensively on mortgages, MBS, and the capital markets. He is the co-author, with Frank Fabozzi and Anand Bhattacharya, of Mortgage-Backed Securities: Products, Structuring, and Analytical Techniques, which was named one of the top ten finance texts in 2007 by RiskBooks. He wrote and edited chapters for The Handbook of Mortgage-Backed Securities, The Handbook of Fixed-Income Securities, Securities Finance, and The Encyclopedia of Financial Models. In addition, Mr. Berliner co-authored papers published in The Journal of Structured Finance and American Securitization. He also wrote the monthly “In My View” column for Asset Securitization Report from 2008-2012.

10-Year Treasury Yield Curve

Compare this chart with the mortgage rates chart to see how the 10-year treasury and mortgage rates are correlated. Read more below to learn how mortgage rates are tied to the 10 year treasury yield. View raw data on U.S. Department of the Treasury website.


Mortgage Rates Today

The current MBS daily rates are shown below in this chart for 5/1 Yr ARM, Jumbo 30 Yr, FHA 30 Yr, 15 Yr Fixed, 30 Yr Fixed. Sign up for our MBS Market Commentary to receive daily mortgage news in your inbox.

About the Author

Robbie Chrisman, Head of Content, MCT

Robbie started his mortgage industry career with internships during high school and college at Peoples National Bank in Colorado, and RPM & Bay Equity in the San Francisco Bay Area. After graduating from The University of Texas at Austin with a degree in Finance in 2014, he went to work at SoFi, where he rose to Director, Capital Markets assisting in the creation of SoFi’s residential mortgage division before leaving to work for TMS in Austin, Texas. From there, he went to work for FinTech startup Riivos in San Francisco and now is the Head of Content at Mortgage Capital Trading (MCT) in San Diego.

 Join Newsletter or Follow MCT on Social Media:

Previous Weekly Market Reviews by Mortgage Capital Trading (MCT)

Sign up for daily mbs market commentary and review previous commentaries by visiting our commentary category page. Join our email list for further MBS market news, subscribe to receive educational articles, whitepapers, relevant updates, and mortgage market commentary. 

MBS Weekly Market Commentary Week Ending 3/31/23

The market reaction went a little “too far, too fast” in regard to the Fed policy pivot. We witnessed the coupon stack (i.e., the price spread between TBA coupons) decompress in more than a trivial manner in a short period. However, the primary mortgage market has been largely reluctant to follow the Treasury rally, and mortgage rates have ultimately not dropped by the same amount as Treasury yields.

MBS Weekly Market Commentary Week Ending 3/24/23

The FOMC raised its benchmark rate by 25 basis points to a new range of 4.75%-5.00% on Wednesday, a middle ground policy move made in the hope of tampering inflation without further harming the banking system. The raise marks the 9th consecutive rate hike since the Fed began hiking in May of last year and brings the target fed funds rate range to the highest level since September 2007. While the central bank’s monetary policy has been aimed at correcting inflation, it has also revealed hidden weaknesses (e.g., entities whose balance sheets relied on low interest rates).

MBS Weekly Market Commentary Week Ending 3/17/23

Next week will reveal the Fed’s resolve on continuing to beat the drum on their aggressive inflation fight. The word until now has been that the central bank will keep hiking interest rates until inflation is under control.

MBS Weekly Market Commentary Week Ending 3/10/23

Events this week likely will lead to a higher peak interest rate than investors had been expecting just weeks ago. Central bankers appear worried about a cycle in which workers seek higher pay to offset inflation’s bite, and in turn trigger more price increases. In fact, inflation remains high because people have jobs and earn enough income to cover stubbornly expensive housing costs. Robust hiring is good for the economy and workers, but elevated pay growth puts added pressure on the Fed to bring down earnings. 

MBS Weekly Market Commentary Week Ending 2/10/23

The week after the jobs report is generally pretty data-light, and this week was no exception. With a dearth of data, market movement hinged on “Fed speak” and consumer sentiment. We saw some volatility return to bond markets as investors built in expectations for a more hawkish Fed. As a reminder, the Fed raised its benchmark rate last week to a range of 4.5% to 4.75%. Let’s run through what we’ve learned in the wake of that decision and a robust U.S. payrolls report that took some wind out of investors’ sails that had hopes for rate cuts by summer.

MBS Weekly Market Commentary Week Ending 2/3/23

As strong as economists may have thought the job market was, it’s even stronger. In addition to headline non-farm payrolls in January (517,000) beating estimates by around 300,000, employment numbers were revised higher for the past two months. Yes, a tight labor market is anathema to any sort of quick stop to the Federal Reserve’s rate hiking cycle, but the growth rate in average hourly earnings is declining, which will be welcome news to Fed Chair Powell and his colleagues. There exists a raging debate among economists over whether we’ll need a sharp rise in unemployment to keep inflation low.