
Treasuries closed the week with a small rally that left the 10-year yield below 2.60% for the first time since early January. The yield curve flattened modestly, with the 2-10 year spread about 1.5 basis points tighter at +15 while the 2-5 year spread also flattened (inverted) by another basis point to -4.3 bps.
*The MBS Weekly Market Profile Report corresponds to the commentary below.*
MBS/Treasury spreads continued their recent tightening trend. The 30-year Fannie and Ginnie II current coupon rates both tightened by 2 bps to the interpolated 5-10 year, while the 15-year Fannie current coupon tightened 3 bps to the 5-year yield. A few lower-coupon rolls (e.g. conventional and Ginnie II 3s and 3.5s) look slightly special, while fuller coupons are rolling in line with their economic values. (The speed assumptions for Ginnie IIs were reduced in our Market Profile to reflect recent issuance and prepayment experience.)
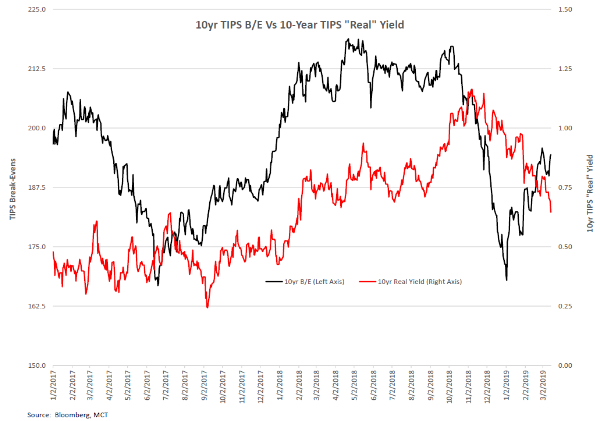
After the dislocations experienced by the markets in December, Treasury yields have settled back into a range-bound trade. Since the beginning of the year, the 10-year yield has moved in a range roughly bound by 2.62% and 2.75%, and its 40-day standard deviation has dropped back into the 3.2 bp/day area (from 4.2 bps/day at the beginning of February). The relative stability of intermediate yields arguably masks a tug-of-war in the markets between real yields (i.e., yields influenced by the expected demand for capital and expected economic activity) and inflation expectations as measured by TIPS break-evens, defined as the spread between yields on on-the-run Treasuries and TIPS for the same maturity. The chart below indicates that since the beginning of the year the two metrics have moved in opposite directions; break-evens have moved roughly 30 bps higher while TIPS yields have declined roughly the same amount. This suggests that the markets are collectively expecting a slowdown in future economic activity while also projecting that inflation will pick up over time. The stability in Treasury yields is therefore masking the changing market expectations for inflation and growth, which becomes apparent only when the dual factors that drive intermediate and long yields are decoupled.
MCT distributed a white paper last week on the Single Security Initiative (SSI), including details on the “Countdown Conference” that was held on March 4th in New York. (The SSI white paper can be accessed here.) June TBAs for 30- and 15-year UMBS began trading last week, and one recent development directly related to the SSI has been the expansion in Gold/Fannie swaps. Because Golds have 10 fewer delay days than Fannies, in theory they should trade at a premium to Fannies; however, liquidity concerns have caused them to trade behind Fannies since they were first issued in the early ‘90s. This means that Golds have been trading significantly cheap to their economic value for decades. (For example, if Gold 3.5s are worth 3/32nds more than Fannies but are trading 4 ticks behind, they are actually trading 7/32nds behind their true value.)
However, the SSI has caused Gold/Fannie swaps to improve dramatically. Since Gold pools can be exchanged for deliverable UMBS pools (along with a payment compensating investors for the longer delay), the differences in value can now be arbitraged, which has caused Golds to trade at a premium to Fannies and in line with their economic value. The accompanying Market Profile shows that the Gold/Fannie swaps have all moved into positive territory, pretty much in line with their intrinsic value. In fact, at a swap of 5/32nds Gold 4.5% TBAs look expensive relative to Fannies. We’d recommend that originators currently short Gold 4.5s should hold off on swapping them until market offerings move closer to their economic value of roughly 3-3+ ticks.
About the Author: Bill Berliner
As Director of Analytics, Bill Berliner is tasked with developing new products and services, enhancing existing solutions, and helping to expand MCT’s footprint as the preeminent industry-leader in secondary marketing capabilities for lenders.
Mr. Berliner boasts more than 30 years of experience in a variety of areas within secondary marketing. He is a seasoned financial professional with extensive knowledge working with fixed income trading and structuring, research and analysis, risk management, and esoteric asset valuation.
Mr. Berliner has also written extensively on mortgages, MBS, and the capital markets. He is the co-author, with Frank Fabozzi and Anand Bhattacharya, of Mortgage-Backed Securities: Products, Structuring, and Analytical Techniques, which was named one of the top ten finance texts in 2007 by RiskBooks. He wrote and edited chapters for The Handbook of Mortgage-Backed Securities, The Handbook of Fixed-Income Securities, Securities Finance, and The Encyclopedia of Financial Models. In addition, Mr. Berliner co-authored papers published in The Journal of Structured Finance and American Securitization. He also wrote the monthly “In My View” column for Asset Securitization Report from 2008-2012.

