MBS Weekly Market Commentary Week Ending 10/4/19

Treasury yields moved lower last week, reflecting growing concerns over the economic outlook as well as equity market woes. The yield on the 10-year Treasury note declined by 15 basis points on the week, while the 2-10 Treasury spread widened by about 7 basis points to +12 bps. The rally in Treasuries was a bit aberrant compared to other sovereign debt, as yields for the major European countries, as well as Japan, were little changed on the week. The Fed Funds futures market currently projects around a 70% chance of an easing at the next Fed meeting on 10/30, up from less than a 50% market-implied probability at the end of September.

MBS continue to struggle in the current rate environment amid high dollar prices, elevated prepayment expectations, and (mostly) poor carry. The Fannie current coupon spread over interpolated Treasuries ended the week 3 basis points wider, its widest level in well over a year. Rolls for 30-year Fannie/UMBS continue to trade at less than 2/32s, with 3.5s and higher rolling at negative levels. However, a few coupons, such as GNII 2.5s and Dwarf 2s, are rolling more than 5/32nds special, reflecting their illiquidity. (The average daily volume for GNII 2.5s was $383 million last week, as compared to $8.3 billion for GNII 3s and $2.6 billion for Fannie/UM 2.5s.) Coupon swaps were under pressure last week, as the rally hurt the relative value of higher coupons. The Fannie and GNII 3.5/3 spreads tightened by around 8 and 12 ticks last week, respectively, although the GNII 4.5/4 swap appeared to expand last week by around 7/32s.

The relative value of 30-year 2.5s is an important consideration, given current rate levels and pooling economics. An interesting and useful exercise is to compare the recent behavior of the Fannie 3.5/3 swap with the 3/2.5 swap given 10-year Treasury yields, as a means of evaluating the recent price performance of Fannie 2.5s relative to higher-coupon Fannies. The scatterplot below shows both swaps on the vertical axis given yields on the 10-year note, as shown on the horizontal axis.

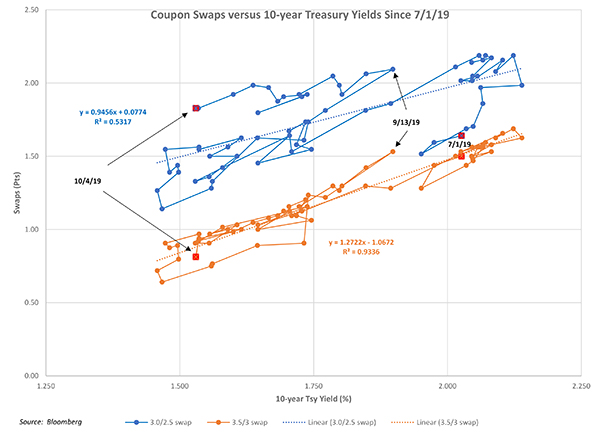
The chart indicates that the 3/2.5 swap has been much more volatile than the 3.5/3 swap over the period beginning on July 1st, and its statistical fit versus 10-year yields (as indicated by the R-square value) is considerably worse. In fact, it’s only since 9/13 that the 3/2.5 swap has exhibited a reasonably consistent price behavior vis a vis the 10-year yield. This arguably reflects the relative lack of an investor constituency for Fannie 2.5s relative to other coupons that are relatively far in-the-money but are more liquid and have a more established investor base. (As an example, the Fed only recently purchased a small amount of Fannie 2.5s, after not having purchased any 30-year 2.5%s since May of 2013.)


About the Author: Bill Berliner

As Director of Analytics, Bill Berliner is tasked with developing new products and services, enhancing existing solutions, and helping to expand MCT’s footprint as the preeminent industry-leader in secondary marketing capabilities for lenders.

Mr. Berliner boasts more than 30 years of experience in a variety of areas within secondary marketing. He is a seasoned financial professional with extensive knowledge working with fixed income trading and structuring, research and analysis, risk management, and esoteric asset valuation.

Mr. Berliner has also written extensively on mortgages, MBS, and the capital markets. He is the co-author, with Frank Fabozzi and Anand Bhattacharya, of Mortgage-Backed Securities: Products, Structuring, and Analytical Techniques, which was named one of the top ten finance texts in 2007 by RiskBooks. He wrote and edited chapters for The Handbook of Mortgage-Backed Securities, The Handbook of Fixed-Income Securities, Securities Finance, and The Encyclopedia of Financial Models. In addition, Mr. Berliner co-authored papers published in The Journal of Structured Finance and American Securitization. He also wrote the monthly “In My View” column for Asset Securitization Report from 2008-2012.

10-Year Treasury Yield Curve

Compare this chart with the mortgage rates chart to see how the 10-year treasury and mortgage rates are correlated. Read more below to learn how mortgage rates are tied to the 10 year treasury yield. View raw data on U.S. Department of the Treasury website.


Mortgage Rates Today

The current MBS daily rates are shown below in this chart for 5/1 Yr ARM, Jumbo 30 Yr, FHA 30 Yr, 15 Yr Fixed, 30 Yr Fixed. Sign up for our MBS Market Commentary to receive daily mortgage news in your inbox.

About the Author

Robbie Chrisman, Head of Content, MCT

Robbie started his mortgage industry career with internships during high school and college at Peoples National Bank in Colorado, and RPM & Bay Equity in the San Francisco Bay Area. After graduating from The University of Texas at Austin with a degree in Finance in 2014, he went to work at SoFi, where he rose to Director, Capital Markets assisting in the creation of SoFi’s residential mortgage division before leaving to work for TMS in Austin, Texas. From there, he went to work for FinTech startup Riivos in San Francisco and now is the Head of Content at Mortgage Capital Trading (MCT) in San Diego.

 Join Newsletter or Follow MCT on Social Media:

Previous Weekly Market Reviews by Mortgage Capital Trading (MCT)

Sign up for daily mbs market commentary and review previous commentaries by visiting our commentary category page. Join our email list for further MBS market news, subscribe to receive educational articles, whitepapers, relevant updates, and mortgage market commentary. 

MBS Weekly Market Commentary Week Ending 3/31/23

The market reaction went a little “too far, too fast” in regard to the Fed policy pivot. We witnessed the coupon stack (i.e., the price spread between TBA coupons) decompress in more than a trivial manner in a short period. However, the primary mortgage market has been largely reluctant to follow the Treasury rally, and mortgage rates have ultimately not dropped by the same amount as Treasury yields.

MBS Weekly Market Commentary Week Ending 3/24/23

The FOMC raised its benchmark rate by 25 basis points to a new range of 4.75%-5.00% on Wednesday, a middle ground policy move made in the hope of tampering inflation without further harming the banking system. The raise marks the 9th consecutive rate hike since the Fed began hiking in May of last year and brings the target fed funds rate range to the highest level since September 2007. While the central bank’s monetary policy has been aimed at correcting inflation, it has also revealed hidden weaknesses (e.g., entities whose balance sheets relied on low interest rates).

MBS Weekly Market Commentary Week Ending 3/17/23

Next week will reveal the Fed’s resolve on continuing to beat the drum on their aggressive inflation fight. The word until now has been that the central bank will keep hiking interest rates until inflation is under control.

MBS Weekly Market Commentary Week Ending 3/10/23

Events this week likely will lead to a higher peak interest rate than investors had been expecting just weeks ago. Central bankers appear worried about a cycle in which workers seek higher pay to offset inflation’s bite, and in turn trigger more price increases. In fact, inflation remains high because people have jobs and earn enough income to cover stubbornly expensive housing costs. Robust hiring is good for the economy and workers, but elevated pay growth puts added pressure on the Fed to bring down earnings. 

MBS Weekly Market Commentary Week Ending 2/10/23

The week after the jobs report is generally pretty data-light, and this week was no exception. With a dearth of data, market movement hinged on “Fed speak” and consumer sentiment. We saw some volatility return to bond markets as investors built in expectations for a more hawkish Fed. As a reminder, the Fed raised its benchmark rate last week to a range of 4.5% to 4.75%. Let’s run through what we’ve learned in the wake of that decision and a robust U.S. payrolls report that took some wind out of investors’ sails that had hopes for rate cuts by summer.

MBS Weekly Market Commentary Week Ending 2/3/23

As strong as economists may have thought the job market was, it’s even stronger. In addition to headline non-farm payrolls in January (517,000) beating estimates by around 300,000, employment numbers were revised higher for the past two months. Yes, a tight labor market is anathema to any sort of quick stop to the Federal Reserve’s rate hiking cycle, but the growth rate in average hourly earnings is declining, which will be welcome news to Fed Chair Powell and his colleagues. There exists a raging debate among economists over whether we’ll need a sharp rise in unemployment to keep inflation low.