MBS Weekly Market Commentary Week Ending 10/21/22

High Rates Leads to Recession Leads to Low Rates

As we said in our blog this week, there exist both fears of a recession that high rates could bring, and anticipation of the potential easing of interest rates that a recession would bring. 

We are beginning to see the Fed’s policy moves take hold, with slowing productivity growth, marginal gains in labor force participation, and home builder sentiment continuing to drop as higher interest rate costs price out a large number of prospective buyers.

QE4 Impact on Homebuilding

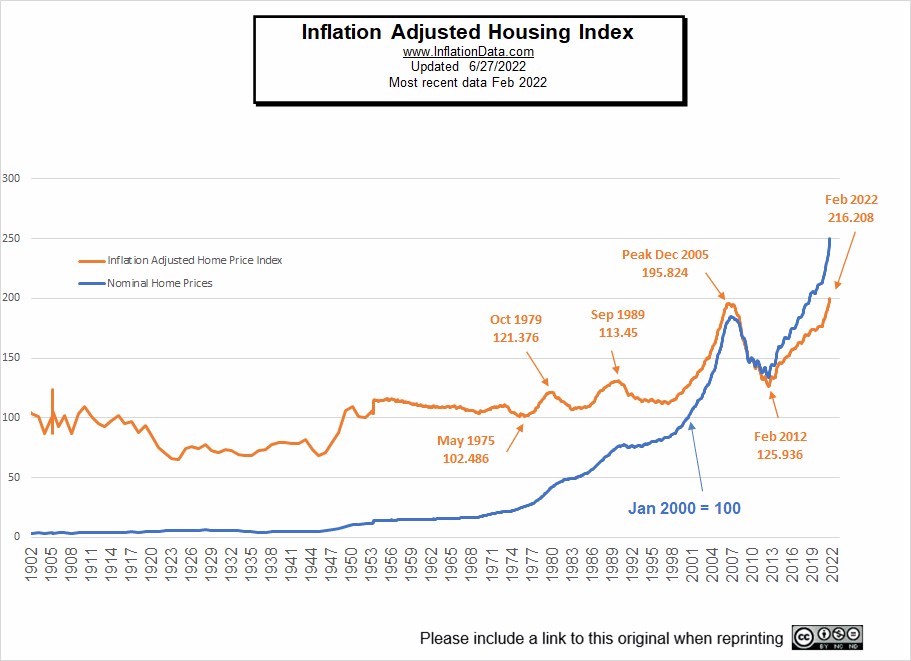
QE4 sent lending rates to record lows and mortgage bond issuance to record highs, but was bad for actual home building, a long running theme in the housing industry. QE eras are normally anathema for home construction. The last two years were a perfect storm of a flight to the suburbs during the pandemic and a shortage of homes for sale, combining to send home prices to record highs (home values rose 43% during QE4, per the S&P Index), but lack of affordability for buyers and supply chain problems have been challenges for home builders. 

From 2010 until 2019, single-family home building sat at an annual rate of just 682,000 new units, the lowest decade since at least the 1950s, when the U.S. population was 60% smaller. Since the beginning of 2020, the run rate has increased to an annualized rate of 1.07 million units, equal to the annualized rate from 1960 until 2009. Estimates put the shortage of single-family homes in this country at between 3 and 4 million units, and the ratio of single family to multi-family home starts stands at 1.46, its lowest level in at least the last three decades.

It’s not just mortgage rates that continue to rise. Fears of a recession and an increase in defaults have pushed up the yields on credit risk transfer securities, insurance for MBS issued by Fannie and Freddie. 

The lack of single-family construction comes as home affordability has fallen to its lowest level since 2006 and out of pocket costs have risen for would-be homeowners, in addition to higher rates driving up monthly payments. The median price of existing home sales is roughly $400,000 compared to $315,000 in January of 2021; so the necessary down payment has increased by over $21,000. It’s little surprise then that both new and existing home sales have fallen. New home sales are down 18% compared to the end of last year with existing home sales down 22% over the same time frame.

The lack of home starts should also help dampen supply into the mortgage bond market and push up prices, acting as a counter against rising rates. Gross issuance this year has been revised down from $2 trillion to $1.8 trillion and next year is forecast to come in around $1.2 trillion (net issuance is expected to fall to around $375 billion).

Refinance Incentive and Alternative Products

U.S. inflation will slow substantially over the next year, despite most forecasters being forced to keep raising their predictions in the near-term. As inflation slows and rates come back down, homeowners with larger loan sizes originated over the past couple of years will have refinance incentive and should react with gusto. The run up in home prices has led obviously to less rate-and-term refinances but also to less cash-out refinances as moving to a higher mortgage rate on a larger sized loan comes with greater pain than if one is in a smaller sized loan. Since QE4 kicked off in March 2020, the average loan sizes seen in a Fannie (+17%), Freddie (+30%), and Ginnie (+26%) pool have all increased substantially. The refinance incentive will be great when these high loan amount borrowers can move into a lower mortgage rate. 

ARMs are increasingly attractive to homebuyers looking for the lowest monthly payment, but lenders often have a hard time including them on rate sheets due to scant market color (color is typically reported in Z-spread) and the inability to properly value them (prices are backed into approximations). Many originators may only be incorporating ARM pricing from a single source. Let us help you. White-label rate sheets can help to maximize your profits and achieve key operational efficiencies and not capitalize on decision lender solutions. If you already create a white-label rate sheet manually, MCT can help streamline the process and report on the results with our successful mortgage pricing engine. Contact us to learn more about this service.

10-Year Treasury Yield Curve

Compare this chart with the mortgage rates chart to see how the 10-year treasury and mortgage rates are correlated. Read more below to learn how mortgage rates are tied to the 10 year treasury yield. View raw data on U.S. Department of the Treasury website.


Mortgage Rates Today

The current MBS daily rates are shown below in this chart for 5/1 Yr ARM, Jumbo 30 Yr, FHA 30 Yr, 15 Yr Fixed, 30 Yr Fixed. Sign up for our MBS Market Commentary to receive daily mortgage news in your inbox.

About the Author

Robbie Chrisman, Head of Content, MCT

Robbie started his mortgage industry career with internships during high school and college at Peoples National Bank in Colorado, and RPM & Bay Equity in the San Francisco Bay Area. After graduating from The University of Texas at Austin with a degree in Finance in 2014, he went to work at SoFi, where he rose to Director, Capital Markets assisting in the creation of SoFi’s residential mortgage division before leaving to work for TMS in Austin, Texas. From there, he went to work for FinTech startup Riivos in San Francisco and now is the Head of Content at Mortgage Capital Trading (MCT) in San Diego.

 Join Newsletter or Follow MCT on Social Media:

Previous Weekly Market Reviews by Mortgage Capital Trading (MCT)

Sign up for daily mbs market commentary and review previous commentaries by visiting our commentary category page. Join our email list for further MBS market news, subscribe to receive educational articles, whitepapers, relevant updates, and mortgage market commentary. 

MBS Weekly Market Commentary Week Ending 3/31/23

The market reaction went a little “too far, too fast” in regard to the Fed policy pivot. We witnessed the coupon stack (i.e., the price spread between TBA coupons) decompress in more than a trivial manner in a short period. However, the primary mortgage market has been largely reluctant to follow the Treasury rally, and mortgage rates have ultimately not dropped by the same amount as Treasury yields.

MBS Weekly Market Commentary Week Ending 3/24/23

The FOMC raised its benchmark rate by 25 basis points to a new range of 4.75%-5.00% on Wednesday, a middle ground policy move made in the hope of tampering inflation without further harming the banking system. The raise marks the 9th consecutive rate hike since the Fed began hiking in May of last year and brings the target fed funds rate range to the highest level since September 2007. While the central bank’s monetary policy has been aimed at correcting inflation, it has also revealed hidden weaknesses (e.g., entities whose balance sheets relied on low interest rates).

MBS Weekly Market Commentary Week Ending 3/17/23

Next week will reveal the Fed’s resolve on continuing to beat the drum on their aggressive inflation fight. The word until now has been that the central bank will keep hiking interest rates until inflation is under control.

MBS Weekly Market Commentary Week Ending 3/10/23

Events this week likely will lead to a higher peak interest rate than investors had been expecting just weeks ago. Central bankers appear worried about a cycle in which workers seek higher pay to offset inflation’s bite, and in turn trigger more price increases. In fact, inflation remains high because people have jobs and earn enough income to cover stubbornly expensive housing costs. Robust hiring is good for the economy and workers, but elevated pay growth puts added pressure on the Fed to bring down earnings. 

MBS Weekly Market Commentary Week Ending 2/10/23

The week after the jobs report is generally pretty data-light, and this week was no exception. With a dearth of data, market movement hinged on “Fed speak” and consumer sentiment. We saw some volatility return to bond markets as investors built in expectations for a more hawkish Fed. As a reminder, the Fed raised its benchmark rate last week to a range of 4.5% to 4.75%. Let’s run through what we’ve learned in the wake of that decision and a robust U.S. payrolls report that took some wind out of investors’ sails that had hopes for rate cuts by summer.

MBS Weekly Market Commentary Week Ending 2/3/23

As strong as economists may have thought the job market was, it’s even stronger. In addition to headline non-farm payrolls in January (517,000) beating estimates by around 300,000, employment numbers were revised higher for the past two months. Yes, a tight labor market is anathema to any sort of quick stop to the Federal Reserve’s rate hiking cycle, but the growth rate in average hourly earnings is declining, which will be welcome news to Fed Chair Powell and his colleagues. There exists a raging debate among economists over whether we’ll need a sharp rise in unemployment to keep inflation low.