
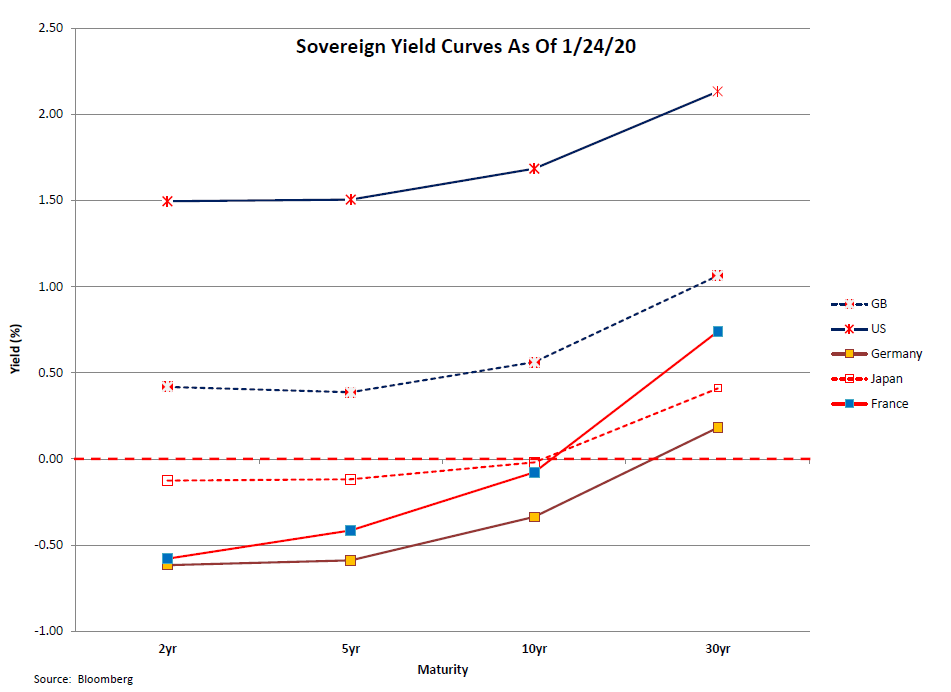
Treasury yields dropped last week, as concerns about the spread of the coronavirus and its economic impact grew. The yield on the 10-year note declined by about 14 basis points from the prior Friday to yield 1.685%, with the rally concentrated in intermediate and long maturities. This left the yield curve markedly flatter, with the 3mo/10yr and 2-10yr spreads narrower by 11 and 7 basis points, respectively. The rally also took other sovereign yields lower; the German and French 10-year notes both experienced 12 basis points declines, the latter reaching negative territory for the first time since early December, as highlighted by the accompanying chart.
*The MBS Weekly Market Profile Report corresponds to the commentary below.*
The German 10-year ended the week yielding -0.34%.) The virus scare, and subsequent rally, have boosted expectations for a Fed rate cut by the fall, with Fed Funds futures projecting a 25 basis point rate cut by the 11/5 meeting.
MBS initially tracked the rally in Treasuries, but ended the week well behind their Treasury hedge ratios. The cumulative 5-day duration-neutral performance of 30-year Fannies/UMBS lagged the 10-year note by 2-8 ticks, while Ginnie IIs trailed their hedge ratios by as much as 10/32s. The weakness in lower coupons was somewhat paradoxical given the bullish flattener that would normally favor the down-in-coupon trade. The 30-year Fannie current coupon spread over interpolated Treasuries tightened a bit on the week, largely reflecting distortions in the current coupon rate resulting from the lowest liquid coupon (UMBS 2.5s) trading above parity.
Conventional rolls remain in line with their break-even values, while Ginnie rolls (especially the February/March rolls) were unusual; the GNII 2.5% through 3.5% roll were 1-1+ ticks special, while the GNII 4% roll ended the week around -4+, reflecting their 104-ish price and brutally fast prepayment expectations. 30-year coupon swaps contracted sharply; the UM30 3/2.5 swap declined by more than 3/8ths of a point, while the same swap narrowed by 1/32nds in Ginnie IIs.
It was reported in several outlets that CFPB Director Kraninger wrote letters to several Senators that the expiration of the non-QM “patch,” which currently allows the GSEs to purchase and pool loans with DTIs above 43%, will be extended “for a short period” into 2021 until a new standard goes into effect. As part of this transition, the CFPB will also propose an amendment to the QM designation that would “move away” from DTI as an element in determining QM eligibility. Reports indicated that the alternative to DTI might including a pricing threshold (e.g., the difference between a loan’s rate and the average prime rate offering for a comparable transaction) as well as a seasoning component that would “create an alternative pathway to QM safe-harbor status…when the borrower has consistently made timely payments for a period.” The new standard will be proposed and/or outlined by May of this year.
This is a positive development for the mortgage and housing markets, as it will eliminate uncertainty for the sizeable portion of the agency-eligible mortgage market where DTIs exceeded the 43% QM target. (According to CoreLogic, mortgages issued using the patch accounted for 16% of all originations in 2018, or approximately $260 billion.) If the patch had been allowed to expire next January, those loans could only be securitized through private-label transactions. While the market for non-QM non-agency deals is growing rapidly, it’s estimated that total issuance volumes were in the area of $35 billion; dumping another $250 billion or so into that market risks giving it a severe case of indigestion and risk disrupting mortgage lending in that sector. However, replacement of the DTI standard with a “pricing threshold” seems redundant, since a pricing standard for QM loans already exists. Moreover, it’s unclear how such a measure would help underwriters determine a borrower’s ability to repay their loan, the underlying factor behind the QM designation.
About the Author: Bill Berliner
As Director of Analytics, Bill Berliner is tasked with developing new products and services, enhancing existing solutions, and helping to expand MCT’s footprint as the preeminent industry-leader in secondary marketing capabilities for lenders.
Mr. Berliner boasts more than 30 years of experience in a variety of areas within secondary marketing. He is a seasoned financial professional with extensive knowledge working with fixed income trading and structuring, research and analysis, risk management, and esoteric asset valuation.
Mr. Berliner has also written extensively on mortgages, MBS, and the capital markets. He is the co-author, with Frank Fabozzi and Anand Bhattacharya, of Mortgage-Backed Securities: Products, Structuring, and Analytical Techniques, which was named one of the top ten finance texts in 2007 by RiskBooks. He wrote and edited chapters for The Handbook of Mortgage-Backed Securities, The Handbook of Fixed-Income Securities, Securities Finance, and The Encyclopedia of Financial Models. In addition, Mr. Berliner co-authored papers published in The Journal of Structured Finance and American Securitization. He also wrote the monthly “In My View” column for Asset Securitization Report from 2008-2012.

