from the desk of Justin Grant
During times of rising rates and dropping loan originations, investors must consider additional strategies to ensure they’re achieving their market share goals while maximizing margins. To do this, MCT’s InvestorMatic Analytics reporting tool is helping investors dissect their purchasing strategies to find hidden opportunities.
In this post, we review top metrics from a sample report available to subscribers. To receive the full sample report and/or schedule a demo of the full interactive tool please contact us today!
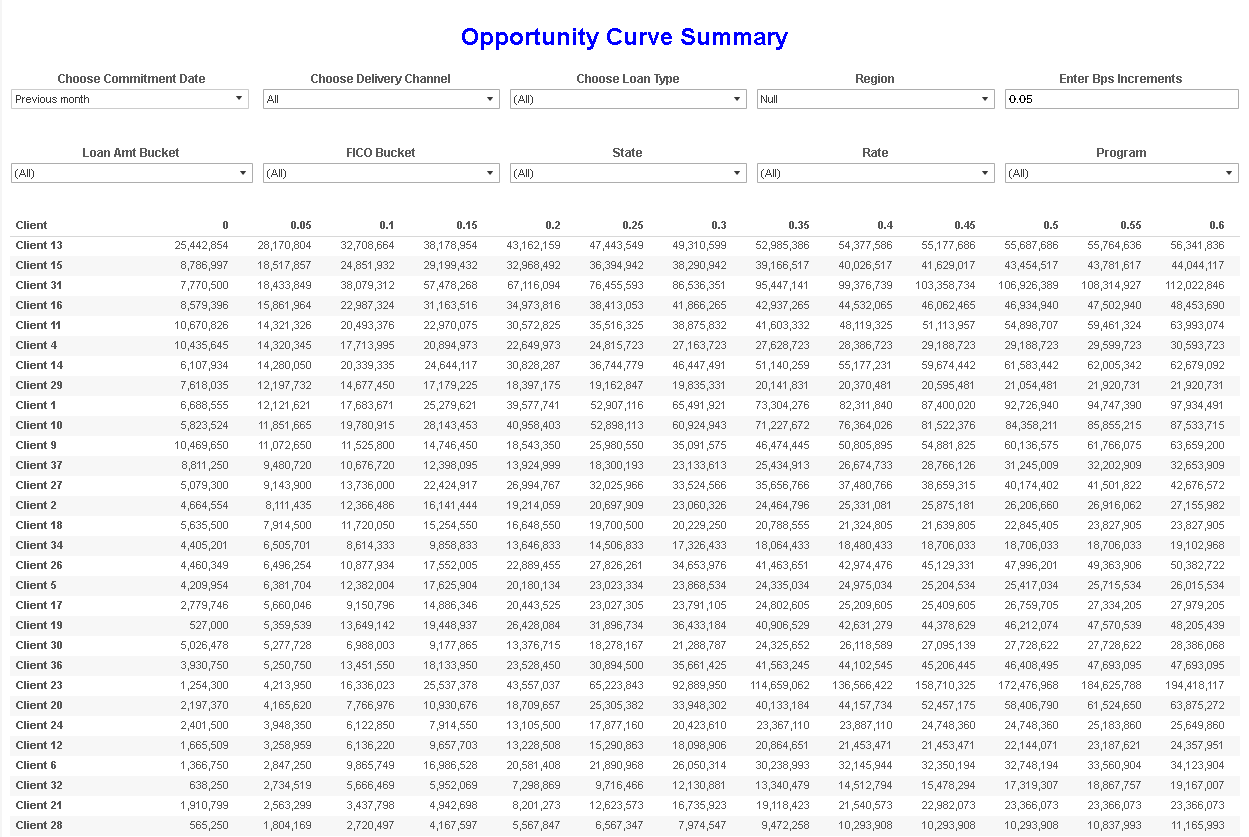
1) Finding New Opportunities
In a competitive market, it’s important to know where there may be pockets of opportunity in order to efficiently improve market share. Leveraging the opportunity curve data in a granular way allows buyers to strategically identify opportunities with their clients instead of blindly reducing margins in a trial and error fashion.
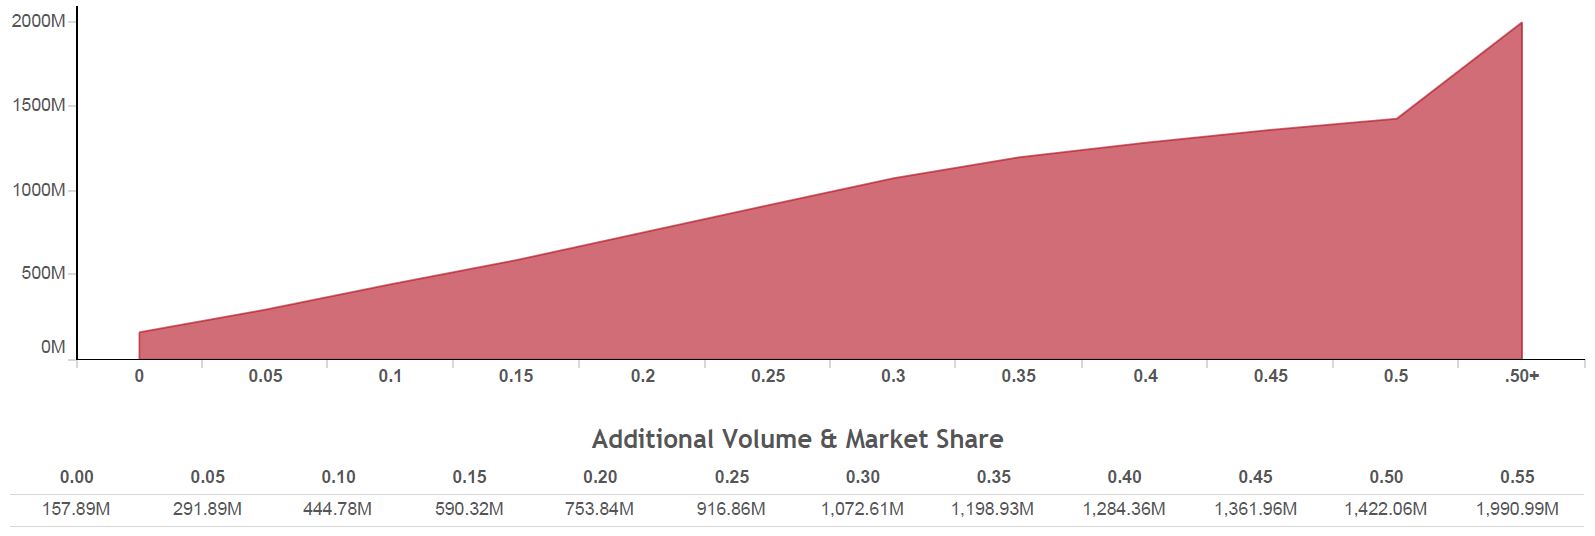
Your Government Opportunity Curve
With an extra 10 bps you could have picked up an additional $2.40 M which would have increased your market share by 3.05%
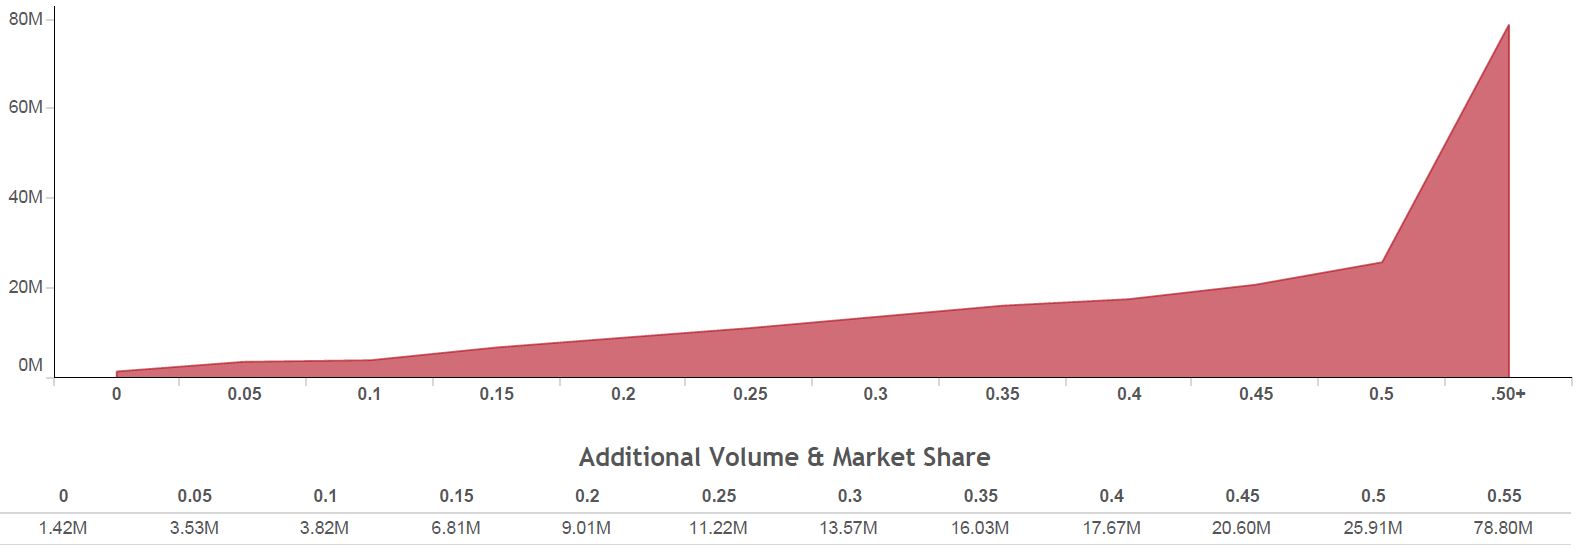
Your Conventional Opportunity Curve
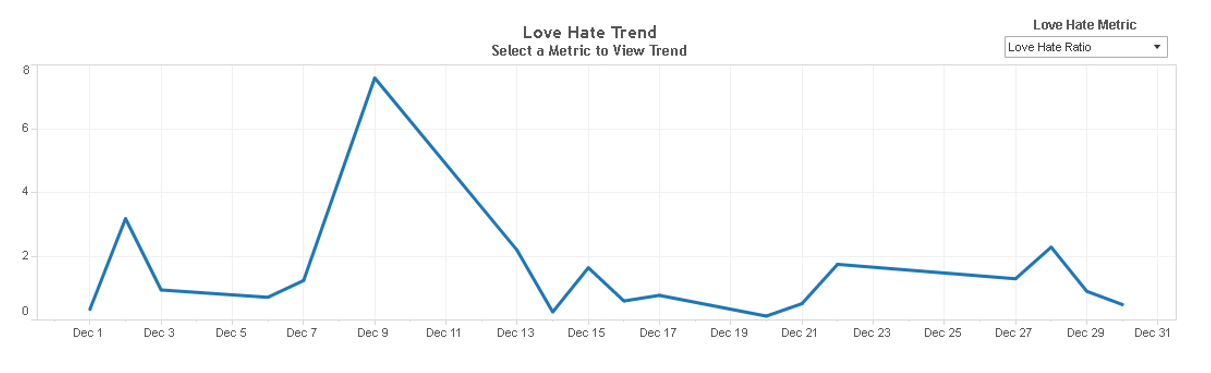
2) Consider Your Love/Hate Ratios
How much do your buyers love selling to you (or not)? Leverage our love/hate metrics to see if you’re getting more loans when you aren’t the best ex than you’re losing when you are. This data can be used to confirm back end efficiencies or inefficiencies and allows users to quantify how much this is worth to their sellers.
The reporting shows the ratio of these key numbers over time which allows users to see if they are trending in the right direction of getting penalized more.
$24,592,650
Total volume sold to you when not the best price
$29,162,713
Total volume sold away when best price
.8433
Love and Hate Volume Ratio
Ready to talk to a MCT representative about Investor Services? Contact Us today!
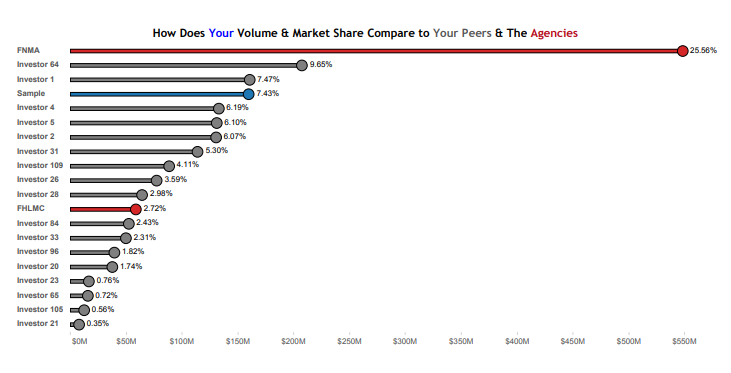
3) Peer Market Share
Looking for trusted data on your position in the market amongst your peers? Our peer market share data does just that so you can view the concentration of top buyers as well as where the agencies stand and how you compare. Since this data is updated daily and you can filter by loan product it’s the perfect way to keep up with changes to your position in the market as you and your competitors get more or less competitive.” Visibility of volume changes amongst your peers also allow you to see if you are over or underperforming them on a regular basis.
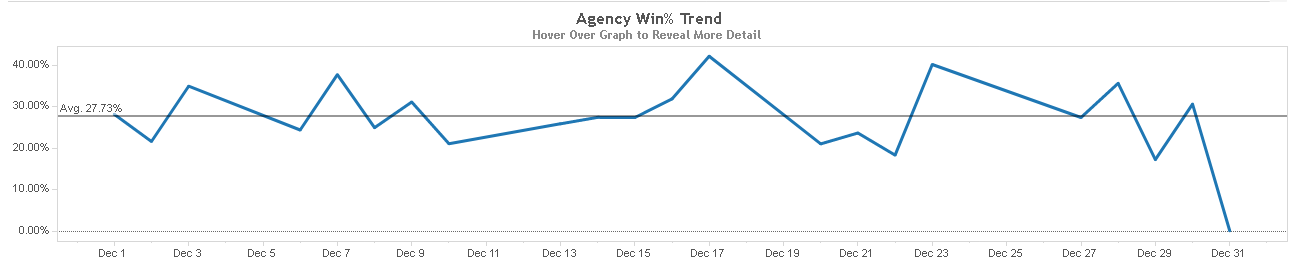
4) Agency Delivery Summary
Dive deeper into the agency’s share of the market over time to help better understand the competitive landscape amongst your lenders. The agency’s market share along with insights into whether lenders are selling their servicing coIssue versus retained are critical for understanding the best execution decisions of your lenders.” In combination with the opportunity curves, this actionable data can further be used to confirm potential opportunities.
27.73%
% of Loans Sold to Agencies
$606.3M
Volume Sold to Agencies
75.31%
% of Agency Loans Sold Co-Issue
24.69%
% of Agency Loans Retained
24
# of Clients Selling to Agencies
36
# of Mutual Clients
Get Started with InvestorMatic Analytics

InvestorMatic Analytics is MCT’s proprietary historical database of best execution analysis and loan sales. Unique reporting and visualizations designed to help optimize correspondent pricing strategies and build market share.
- Summary Reporting, Opportunity Curves & Love/Hate Factor
- Analyze numerous metrics across a myriad of loan parameters
- Web based platform provides 24/7 access
- Interactive user interface allows users to filter data by different parameters and answer questions on the fly
- Set up views to be automatically emailed at user specified time frame
Contact us today to learn more about our Investor Services!
About the Author:
Justin Grant, Director of Investor Services, MCT
Mr. Grant began his career with MCT in 2006 as a junior trader and has quickly ascended the ranks to his current position as SVP of Capital Markets, which he was promoted to in January of 2014. During this period, he has been responsible for overseeing the risk management and loan sale execution for many of MCT’s clients and specializes in those that are federally chartered banks. Mr. Grant was also the creator of MCT’s first robust back end pricing engine that would power the fair market valuations for all of its clients. Mr. Grant’s areas of expertise include pipeline hedging, pull through analytics, SAS reporting, MSR valuations, MBS issuance and risk management. On top of his daily account management duties Mr. Grant manages the Business Intelligence division of MCT and also consults with the analytics team that is responsible for much of the research that is the foundation of the award-winning HALO program.
Mr. Grant graduated Cum Laude from the University of California, San Diego, and holds a B.S. in Management Science.