Updated 10/23/2023
In this article, we’ll explain the key concepts related to pull-through rate analysis, mortgage pipeline forecasting, and discuss its importance in deriving an accurate mortgage pipeline hedging recommendation.
This article is an adaptation of Chapter 3 of the Mortgage Professionals Handbook titled “Pipeline Pull-Through Analysis” by MCT’s COO, Phil Rasori. Read the full whitepaper
Maintaining optimal hedge coverage mitigates risk between mortgage rate lock and funding, and is one of the most important responsibilities of the Secondary Manager (and their hedge advisor).
A key requirement for maintaining optimal coverage is accurate mortgage pipeline forecasting of the probability that a given application, and the pipeline more broadly, will “pull-through” to close and fund. Loan characteristics, market movements, and extraneous factors add further complexity to the forecast equation in order to accomplish successful mortgage pipeline risk management.

Mortgage Pull-Through Rate Definition:
A metric used to assess the proportion of successfully processed and funded loan applications relative to the total number of formally submitted loan applications within a specific timeframe.
Table of Contents – Pull-Through Rate Analysis Explained
- What is a Pull-Through Rate?
- Pull Through Rate Formula
- The Impact of Lock Desk Operations and Loan Stage
- Understanding Pull-Through Rate Variability in the Secondary Mortgage Market
- Leveraging Lock Desk Policies for Loan Commitment and Risk Management
- Market Movement’s Influence on Loan Characteristics
- Navigating the Impact of Interest Rate Changes
- Understanding the Impact of Fallout
- Strategizing Market-Adjusted Pull-Through Rate
- Executing a Step-by-Step Pull-Through Rate Analysis
What is a Pull-Through Rate?
The pull-through rate mortgage definition is the probability at a point in time that a given Interest Rate Lock Commitment (IRLC) will close and fund.
Correctly forecasting this rate is the single most important factor in generating an accurate hedge recommendation and accurate mortgage pipeline risk management. Effective mortgage pipeline forecasting is a key component of determining how much hedge coverage a pipeline will need.
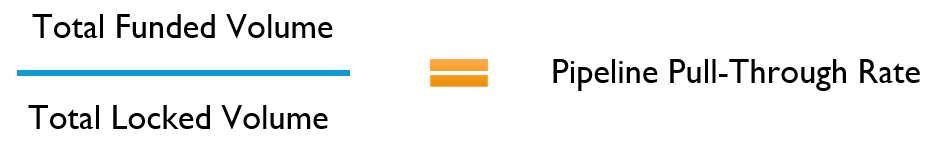
This is different from an application conversion rate because we are measuring the probability of a loan application actually closing and funding. It is calculated by taking the total funded volume of a pipeline and dividing that number by the total locked volume.
Below is an example of the pull through rate of a mortgage loan pipeline at a point in time. Please note that this is different from the “Forecasted Pull-Through Rate” which is a function of the pull-through analysis model that will be discussed later in this article.
Optimizing Pull-Through Rate: The Impact of Lock Desk Operations and Loan Stage
Predicting mortgage pipeline pull-through rates is vital for effective hedge recommendations and risk management. Analyzing loan history and market conditions helps optimize the use of TBA MBS for hedging interest rate-driven changes.
As interest rates move up or down, loans will inevitably “fall out” of the pipeline due to any number of reasons. By analyzing what has happened in the past with each individual loan type alongside various market conditions, originators can confidently predict the probability of fallout and hedge only the percentage of loans that are expected to pull through.
“Forecasting a mortgage pipeline pull-through rate is the single most important factor in generating an accurate hedge recommendation and mortgage pipeline risk management.” – Phil Rasori, Chief Operations Officer at MCT, from Chapter 3 of the Mortgage Professionals Handbook
Read full chapter from handbook
Executing on a mandatory basis is facilitated by hedging your pipeline. Mortgage pipeline hedging allows a lender to neutralize interest rate-driven changes to loan value between the time a rate is locked with the borrower and the time the loan funds.
Once the associated pull-through ratio is taken into account, financial instruments called To-Be-Announced Mortgage-Backed-Security (TBA MBS) corresponding to the pull-through-adjusted open mortgage pipeline, can be sold as a hedge.
By selling the TBA MBS, you have entered into a short position. When you buy the TBA back in the future (to exit the position), the value of your short position will have moved in the opposite direction of the underlying asset (your “IRLC’”s in this case – Interest rate lock commitments).
Since the value of your IRLC’s are, in large part, derived from the TBA MBS market, TBA’s typically make an ideal hedge vehicle. Your short position effectively hedges your IRLC’s since they move in approximately equal and opposite directions. The volume of TBA’s to be sold for hedging purposes depends on your expected pull-through rate calculation.
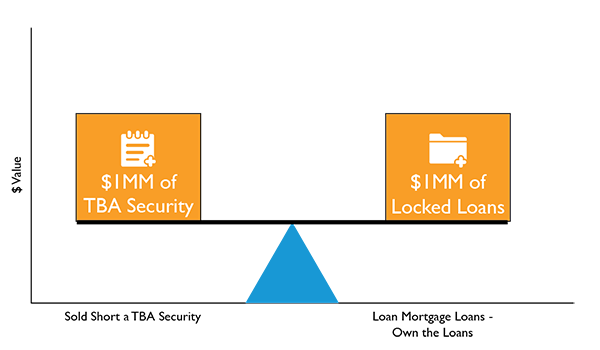
**While this graph illustrates the exact balance of TBA securities to locked loans, a more realistic representation of coverage would be around the 90% mark. For example, 1MM of locked loans with a 90% pull-through rate would be hedged by 900K of TBA securities.
Understanding Pull-Through Rate Variability in the Secondary Mortgage Market
Understanding pull-through rates in the mortgage lifecycle is crucial. High rates indicate low fallout, but it doesn’t guarantee good hedge performance. Market-driven pull-through variability is key, and stage influences borrower commitment. Recent studies delve into this correlation.
In this section, we will explore the key concepts of fallout and pull-through in the open mortgage pipeline, focusing on rate variability. The stages of the loan’s lifecycle from lock to hedge to funding play a crucial role in understanding the dynamics of pull-through rates.
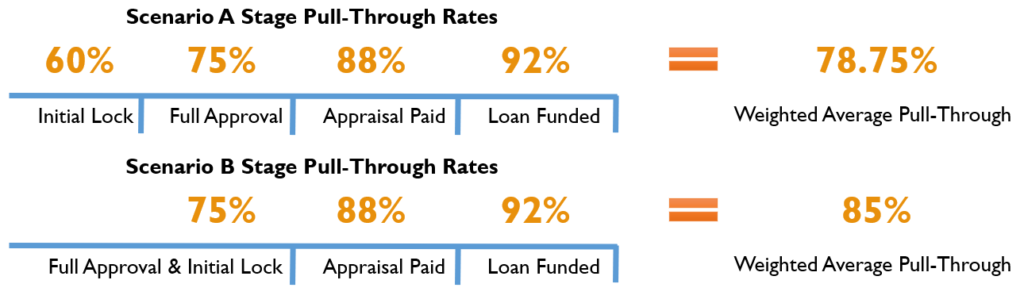
For instance, a high pull-through rate of 80% in your mortgage pipeline indicates a 20% fallout rate. This rate variability is an important factor to consider when analyzing the open mortgage pipeline.
Regardless of the type, origination channel, or purpose of the loan, the actual stage of the loan will significantly influence its sensitivity to market movement. As the loan progresses towards funding, borrowers become increasingly committed to the loan. Once the appraisal has been paid, borrowers become financially invested in the loan, reducing the chances of fallout.
To delve deeper into this topic, recent studies and articles have explored the correlation between pull-through rates and market-driven pull-through variability in the mortgage industry. These studies provide valuable insights into the factors influencing pull-through rates and their implications for lenders and capital markets managers.
By staying informed about the latest research and industry trends, mortgage professionals can enhance their understanding of pull-through rate variability and make data-driven decisions to optimize their mortgage processes and mitigate risks.
High Pull-Through Rate Does Not Equate to Greater Hedge Performance!
As we look at pull-through over the course of the mortgage process, it is important to understand that a high pull-through rate does not necessarily translate to great hedge performance. The extent to which pull-through rates are correlated to the market (also known as market-driven pull-through variability) determines hedge costs and risks over time.
As a lender, you want to drive high pull-through rates for obvious reasons. But, as a capital markets manager, the consistency and predictability of pull-through rate is of primary importance.
Enhancing Pull-Through Rates: Leveraging Lock Desk Policies for Loan Commitment and Risk Management
Lenders can control pull-through rates by adjusting lock desk policies. Pushing rate lock commitment deeper into the loan process reduces interest rate risk, increasing the likelihood of loan completion. Loan stage plays a crucial role in reducing market-driven fallout.
The greatest control point that a lender possesses over the future behavior of their pipeline pull-through rate are through their lock desk policies.
When a lender guarantees an interest rate to a borrower in an Interest-Rate Lock Commitment (IRLC), the lender is left in an exposed position with regard to interest rate fluctuations in the market.
This is known as interest rate risk, and is the primary risk addressed by pipeline hedging.
Pushing the rate lock commitment further into the loan process will increase the probability that the loan will pull-through, regardless of loan characteristics.
The stage in which the loan resides is the most important variable influencing market-driven fallout. As the loan progresses, the borrower becomes more committed and less sensitive to market movements. Meaning, a borrower is less likely to take his/her business elsewhere even if interest rates have improved since locking.
Advancing the lock further into the loan process will increase pull-through and decrease variability, while pushing loans into stages closer to funding will increase pull-through rate, and reduce the chances of a borrower walking due to market conditions.
Ready to dive deeper? Download our latest whitepaper!
")
Market Movement’s Influence on Loan Characteristics: Impact on Borrowers, Purpose, and Origination Channels
Mortgage pipeline forecasting factors in loan purpose, origination channel, borrower sophistication, and branch/loan officer influences, considering market movement’s impact on pull-through stability and lender options.
Below are several characteristics of loans and borrowers that are taken into consideration with mortgage pipeline forecasting. Later, we overlay the market movement influence on these as well.
- Purpose of the loan: pull-through is more stable for a purchase loan than a refinance given a change in interest rates.
- Origination channel: rate locks generated from consumer-direct internet advertising tend to be more volatile than traditional realtor referrals.
- Borrower sophistication: financially sophisticated borrowers have more lender options and are alerted to market changes at a faster rate.
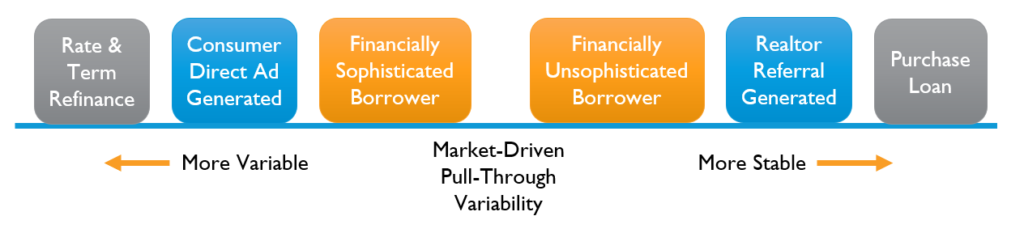
Individual branches and loan officers may also have unique influences on pull-through which can be measured and forecasted for improved hedge performance.
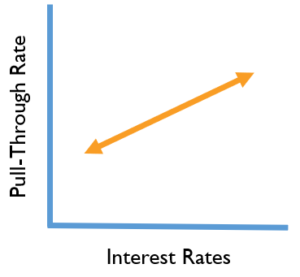
Maximizing Pull-Through Rate: Navigating the Impact of Interest Rate Changes
Pull-through rate forecasts adjust hedging coverage based on market-driven changes and loan stages. The inverse relationship between pull-through rates and interest rates poses a key risk in pipeline hedging, impacting the value of rate locks for lenders as loans progress.
 Pull-through rate forecasts are used to derive hedging coverage recommendations until the loan is funded or falls out. During this phase, the hedging coverage is adjusted based on changes to the pull-through rate, which occur due to market moves as well as changes in loans’ stages change.
There is an inverse relationship between pull-through rates and interest rates. As interest rates rise, borrowers want to stay with their lower rate which increases the likelihood that the loans will pull-through to funding. As interest rates decrease, borrowers are more likely to jump ship with another lender to go for the lowered rate.
This relationship is the primary source of risk posed to a lender engaged in pipeline hedging.
When interest rates fall, the current IRLC becomes more valuable for the lender, however, fewer of these rate locks can be expected to fund. When interest rates rise the current IRLC loses value from the lender’s perspective, but a greater percentage of these locks will be expected to fund. Note that the lock’s sensitivity to rates changes as loans’ stages change, as described above.
Improving Pull-Through Rate Analysis: Understanding the Impact of Fallout
In the final stage, locks either fall out or get funded, impacting pull-through rate calculations. Fallout occurs when the borrower doesn’t close the rate-locked loan, often due to underwriting issues.
At this final stage, the lock completes its lifecycle when it either falls out and/or is funded. For the purposes of pull-through rate, we will discuss the two different types of fallout and how they affect the final calculations.
If a rate lock commitment does not carry through to funding, the lock is recorded as a fall-out. While the lender guarantees the rate and price, the borrower doesn’t guarantee that they will close, leading to the IRLC not closing and “falling out” of the pipeline.
The most common cause of fallout unrelated to market movement is the underlying loan being denied at underwriting due to borrower credit or appraisal value issues.
Soft Fallout in a Mortgage Loan Pipeline
Soft fallout involves loan changes to prevent cancellations due to rate renegotiations. Falling interest rates lead to lower pull-through rates, affecting lender profitability. Extensions unrelated to market changes aren’t considered soft fallout.
In the scenario of a Soft Fallout result, the terms of the loan are modified to the detriment of the lender in an effort to keep the loan from being cancelled. Soft fallout occurs primarily due to rate renegotiations.
When interest rates fall, pull-through rate goes down because the borrower is more likely to “jump ship” to get a better rate. In order to avoid a complete loss, the lender might agree to reduce the interest rate and/or points charged to keep the borrower from cancelling.
Renegotiated locks are not equivalent to fully pulling through because there is a deterioration in profitability for the lender.
Calculating soft fallout is done on a case-by-case basis with the percentage of total profitability detriment equalling the percentage of effect on the total pull-through of that loan. For example, if the renegotiation resulted in a 50% decrease in profitability for the lender, the soft fallout would be 50% the normal hard fallout effect.
Hard Fallout in a Mortgage Loan Pipeline
Hard fallout occurs when an IRLC is completely terminated due to various reasons, including borrower cancellation or choosing another lender. Calculating hard fallout involves tracking the difference between locked and funded volumes over time.
When hard fallout happens the IRLC is completely terminated and no part of the original rate or pricing guarantee will exist. For example, the loan application can be cancelled by the borrower, declined by underwriting, or the borrower could jump ship to another lender for a more favorable rate or term.
To calculate hard fallout, find the difference between the total locked volume and total funded volume of your mortgage pipeline. This calculation does not happen at one time but takes place over time as more loan data is gathered.
Proactive Forecasting: Strategizing Market-Adjusted Pull-Through Rate
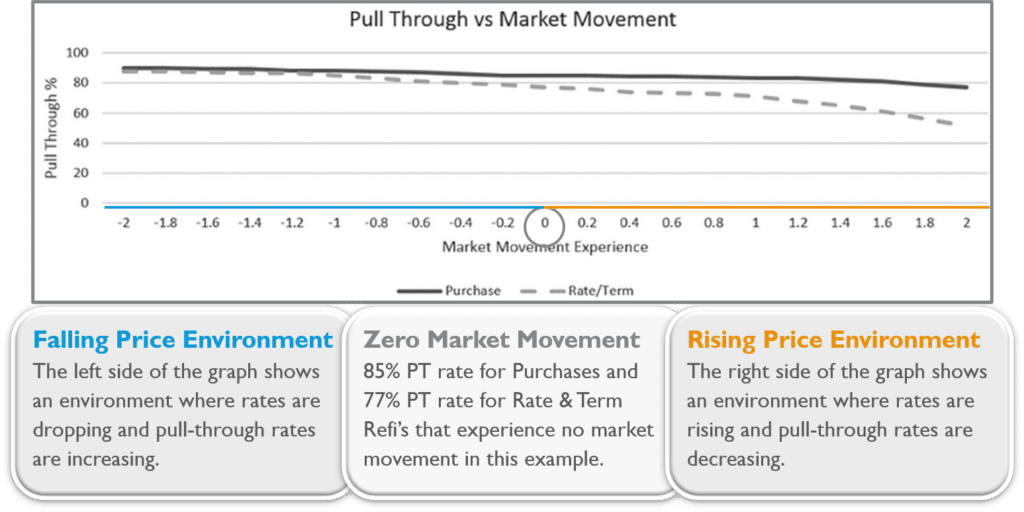
Your zero market pull-through rate is the baseline measure for pull-through and represents your pull-through in a neutral interest rate environment. The baseline pull-through rate is calculated for each stage. However, the baseline pull-through changes as interest rates move. Through regression analysis, we can quantify how much influence interest rate changes have on your baseline pull-through. We call this measure the Market Beta.
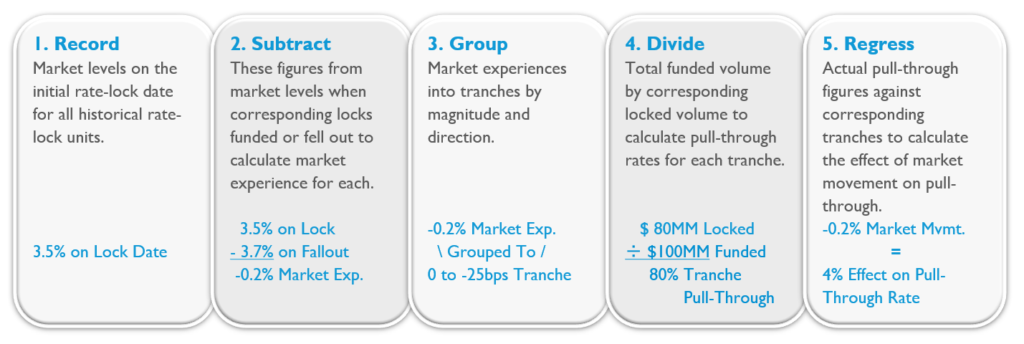
Comprehensive Guide: Executing a Step-by-Step Pull-Through Rate Analysis:
- Access data on the loans that have been in the pipeline and have either funded or fallen out. Check the Market Levels on the initial rate-lock date for all units.
- Note the market rate of each loan when the IRLC began, then compare that to the market rate when the loan exited the pipeline. This is the market experience.
- All of the loans should then be grouped into tranches based on their magnitude and direction.
- Separately, calculate the Pull-through rates for each of the tranches (remember, it was total funded volume divided by total locked volume).
- Out of this scatterplot data, you create a regression, or a line of prediction through the data that will illustrate the percentage effect that each bps market movement will have on your baseline pull-through rate. The regression is calculated against loan pricing so the line will be downward sloping. The line of best fit is a Market Pull-Through Curve, also referred to as a the Pull-Through Beta or Market Beta.
- When you look at the pull-through percentage when the market is at zero (not moving), that is when you have identified your baseline pull-through figures, also known as Zero Market Movement figures.


- Apply the market adjustment in real time to the slope you have created to determine the market adjustment that you need to make to that baseline pull-through figure to generate the pull-through forecast.
Lastly, take the weighted average of the resultant pull-through values. This is your forecasted locked pipeline pull-through rate!
Get Started with a Pipeline Pull-Through Analysis
Calculating a forecasted pull-through rate may be the most critical factor involved in generating a hedge recommendation, but the fundamental building block of an accurate forecast is a robust historical pull-through analysis.
The lender that draws upon the current environment from the borrower perspective along with historical data trends will be able to generate the most accurate pull-through forecasts and the most effective hedge strategies.
Schedule a meeting with MCT and get started with a robust Pipeline Pull-Through Analysis, to examine how you can improve efficiency and profitability.

Further Learning About Mortgage Pipeline Hedging Strategies
By reading this overview, we hope you have obtained a comprehensive view of how pull-through rates affect hedging on a mandatory basis. If you would like to learn more, we encourage you to read Chapter 3 of the Mortgage Professionals Handbook titled “Pipeline Pull-Through Analysis” by MCT’s COO, Phil Rasori, on which this article is closely based.
Have questions and comments? Sometimes it seems like the more you learn, the less you know, that’s why the mission of MCT is to provide the leading capital markets content to bring clarity to complex subjects such as this.
Contact us to learn more about the many ways that we support lenders in hedging their mortgage pipelines.
Related Articles:
- MCT Whitepaper: 15 Strategies for Lenders to Improve Profitability
- Rate Renegotiation: Policies that Protect Profit
- Introduction to Mandatory Loan Sale Delivery
- Whitepaper: How to Manage Long-Term Interest Rate Locks