As the leader in capital markets software and services, MCT supports more lenders with hedging and pipeline management solutions than any other single provider. This privileged position allows us to aggregate and analyze a meaningful population of data and translate it into macro trends and insights.
MCT-collected statistics are unique to the industry given the diversity of lenders (e.g., sizes, products/services offered, business models) across our national footprint.
MCT’s rate lock activity indices are based on actual locked loans, not applications, and are therefore a more accurate indication of industry lock activity than other potential stats. Especially in a tight purchase market, we firmly believe our methodology of using actual loans locked (rather than applications) is a more reliable metric. Why? There is a higher likelihood of having multiple applications per funded loan, and pre-qualifications do not convert at as high of a rate in the current market as has historically been the case – especially when applications are counted at the early stage of entering a property address.
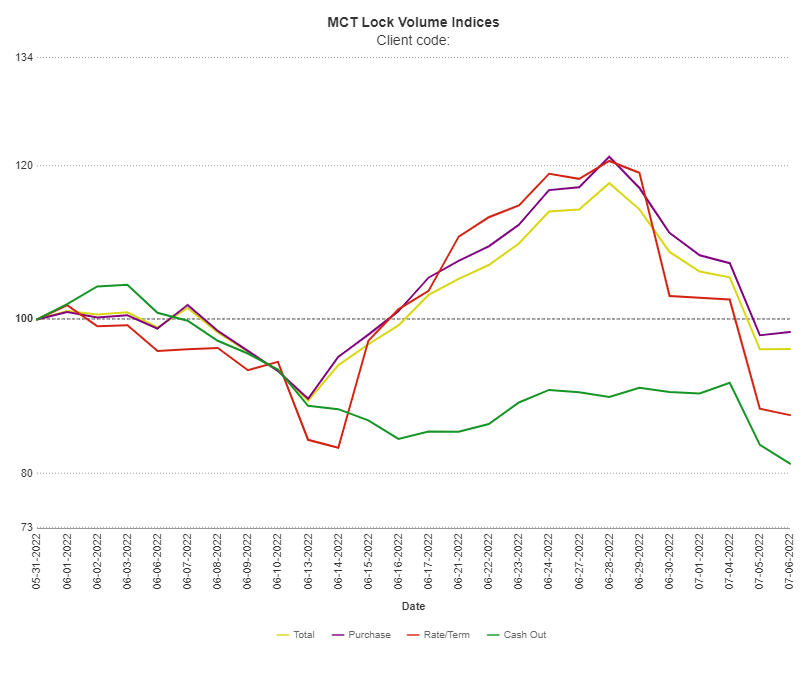
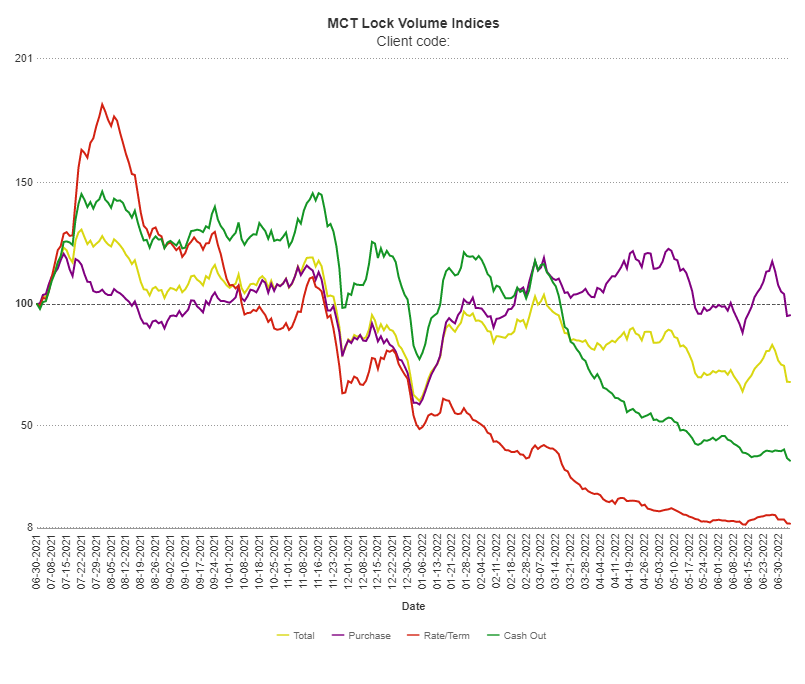
As mentioned, our stats represent a broad and balanced cross section of several hundred lenders across retail, correspondent, wholesale, and consumer direct channels. The lock volume indices break out data by transaction type (purchase, rate/term refinance, and cash out refinance), and the below charts also include year-over-year breakdown of rate lock activity.
June 2022 Rate Lock Data
June MCTlive! Lock Volume Indices show that that total mortgage rate locks by dollar volume decreased 3.8 percent in June, and total lock volume is down 32.0 percent from a year ago as purchases continue to make up most originator volume. Purchase locks declined 1.63 percent month-over-month, but a mere 4.6 percent from a year ago. The increase in mortgage rates is also evident as refinance volume continues to fall. Rate/term refinances are down 12.4 percent and cash out refinances are down 18.7 percent month-over-month. From one year ago, cash out refinance volume is down 64.5 percent, while rate/term refinance volume has dropped 90.4 percent. Given rate/term refinance volume was already down 90 percent year-over-year in the May MCTlive! Lock Volume Indices, this month’s drop does not change the total much. Please note that loan sizes were up 8.3 percent over the past year, with the average loan amount increasing from $291k to $315k.
MCT supports more lenders with hedging and pipeline management solutions than any other single provider. MCT’s privileged position allows it to aggregate and analyze a meaningful population of data and translate it into macro trends and insights. MCT-collected statistics are unique to the industry given the diversity of lenders (e.g., sizes, products/services offered, business models) across its national footprint.
MCT data represents a balanced cross section of several hundred lenders among retail, correspondent, wholesale, and consumer direct channels. A broad-based view of the entire market provides a more accurate picture of mortgage originations versus indices that are influenced by mega lenders. The data is also broken out by transaction type: purchase, rate/term refinance, and cash out refinance.
It is important to note that MCT’s rate lock activity indices are based on actual dollar volume of locked loans, not number of applications. Especially in a tight purchase market, MCT believes its methodology (using actual loans locked vs. applications) is a more reliable metric. There is a higher likelihood of having multiple applications per funded loan, and prequals do not convert at as high of a rate in the current market as has historically been the case – especially when applications are counted at the early stage of entering a property address.
About MCT
Founded in 2001, Mortgage Capital Trading, Inc. (MCT) has grown from a boutique mortgage pipeline hedging firm into the industry’s leading provider of fully integrated capital markets services and technology. MCT’s offerings include mortgage pipeline hedging, best execution loan sales, business intelligence and analytics, outsourced lock desk solutions, MSR valuation, hedging, and bulk sales, and the world’s first, truly open marketplace for loan sales. MCT supports independent mortgage bankers, depositories, credit unions, warehouse lenders, and correspondent investors of all sizes within its award-winning digital platform, MCTlive!. Headquartered in sunny San Diego, MCT also has offices in Healdsburg, CA, Philadelphia, PA and Texas. For more information, visit https://mct-trading.com/ or call (619) 543-5111.
- Growing for Your Needs – Since 2001, MCT has grown from a pipeline hedging services specialist into a fully integrated provider of capital markets services & software.
- Capital Markets Expertise – Through a combination of unparalleled industry experience and relentless focus on data, MCT is pioneering the future of capital markets technology. From MCTlive!, to MSRlive!, to our award-winning MCT Marketplace – MCT pushes the envelope to exceed client expectations.
- Clients & Employees Agree – MCT delivers unparalleled customer service and prides itself on being a regular winner of San Diego’s “Best Place To Work” Award.


