The release of MSRlive! 4.0 revolutionizes MSR portfolio analysis with enhanced valuation reporting and granular loan-level insights. Users can now access these meaningful and objective reports to understand what’s driving MSR values and portfolio dynamics.
Our clients now have a reporting system that’s not just powerful but also transparent. For the first time, they have the tools to make sense of the drivers behind period over period valuation changes — in a way that no other MSR portfolio management platform in the industry can offer.
In this blog post, Azad Rafat, Senior Director of MSR Services at MCT, demonstrates how the platform’s new portfolio report and detailed results tabs deliver unprecedented visibility into MSR valuation drivers and portfolio dynamics.
Overview of MSRlive! 4.0:
- Comprehensive portfolio reporting that consolidates critical metrics, including original balance, UPB, and mortgage rates.
- Detailed loan-level analysis capabilities enabling sophisticated trend identification.
- Advanced performance metrics tracking average life, break-even points, and free cash flow periods.
- In-depth investor value summary reports with detailed assumptions and remittance data.
Portfolio Reports: Explore the MSR Analytics Hub
The new portfolio reports tab serves as a command center, organizing critical MSR data through seven powerful views:
- Portfolio Value Summary: Consolidates key portfolio metrics, including original balance, unpaid principal balance, loan count, and monthly payment data
- Assumptions: Details underlying valuation parameters and modeling inputs
- Investor Value Summary: Tracks remittance patterns and investor-specific metrics
- Standard Value: Provides normalized portfolio valuation benchmarks
- Standard Portfolio: Offers standardized portfolio performance metrics
- Distribution: Visualizes portfolio composition and concentration metrics
- Cash Flow Summary: Maps projected cash flows and revenue streams
This centralized reporting hub transforms complex MSR data into actionable insights, enabling faster, more informed portfolio decisions.
Portfolio Value Summary
The portfolio valuation summary transforms complex MSR data into an intuitive dashboard that helps servicers make data-driven portfolio decisions. This powerful analytics hub consolidates critical performance metrics, valuation drivers, and market indicators into a single view.
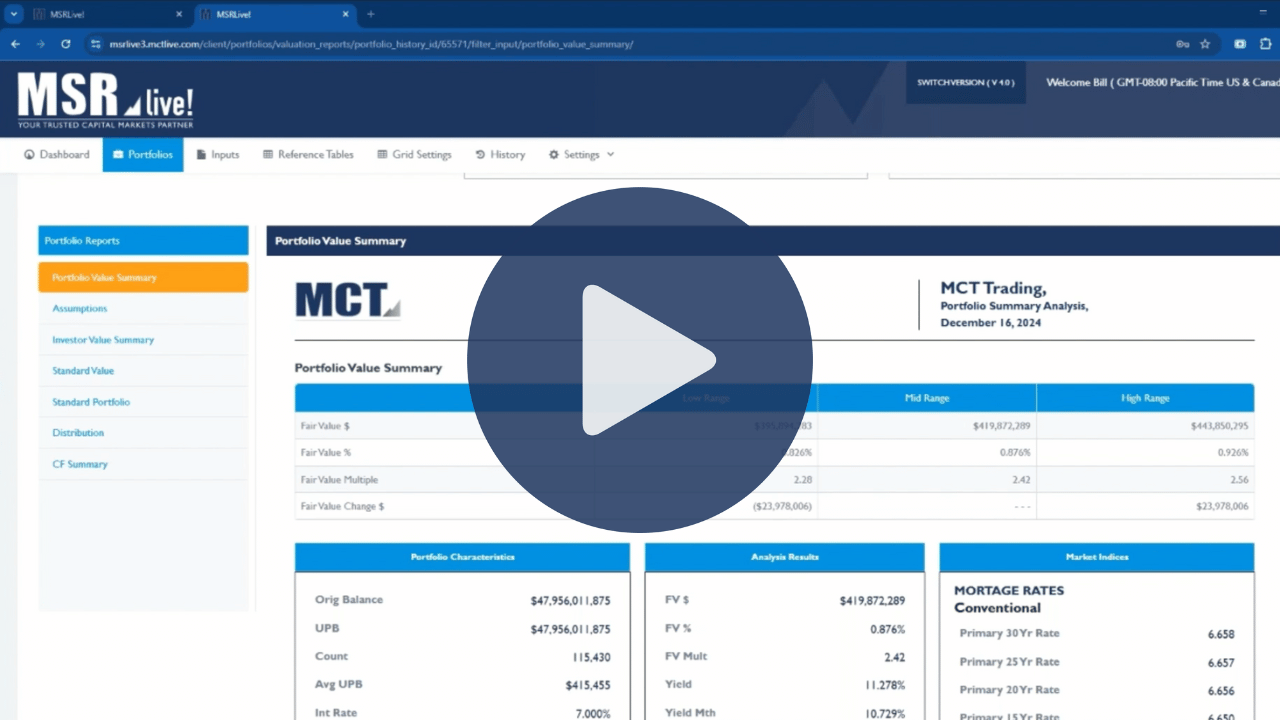
By combining portfolio fundamentals with forward-looking metrics, the portfolio value summary equips MSR portfolio managers with the comprehensive data they need to validate valuations and make strategic adjustments.
Investment Metrics:
- Average loan life calculations
- Portfolio break-even analysis
- Free cash flow period tracking, showing both investment recovery timeline and ongoing revenue streams
Core Portfolio Data:
- Consolidated portfolio statistics including original balance, unpaid principal balance, loan count, and average UPB
- Monthly payment metrics including base, tax & insurance (T&I), and principal & interest (P&I)
- Primary mortgage rates across all products (30-year, 25-year, 20-year, 15-year, 10-year)
- Government product rates and float income indices
Valuation Drivers:
- Fair value in dollars and percentage multiples
- Portfolio yield and rate of return
- Projected metrics for Conditional Prepayment Rate (CPR), voluntary and involuntary prepayment rates, and annual default rates
This consolidated view enables servicers to track their investment recovery timeline and analyze ongoing cash flows simply.
The integration of market rates, performance indicators, and projection models creates a powerful tool for proactive portfolio management. Users can quickly assess how long it takes to recover their initial investment and forecast the subsequent free cash flow period, providing crucial insights for portfolio optimization.
Assumptions
There are a multitude of variables within the MSRlive! Platform. The assumptions tab provides a view of the predominant variables influencing MSR valuations by consolidating crucial market indicators and operational parameters into an easily digestible format.
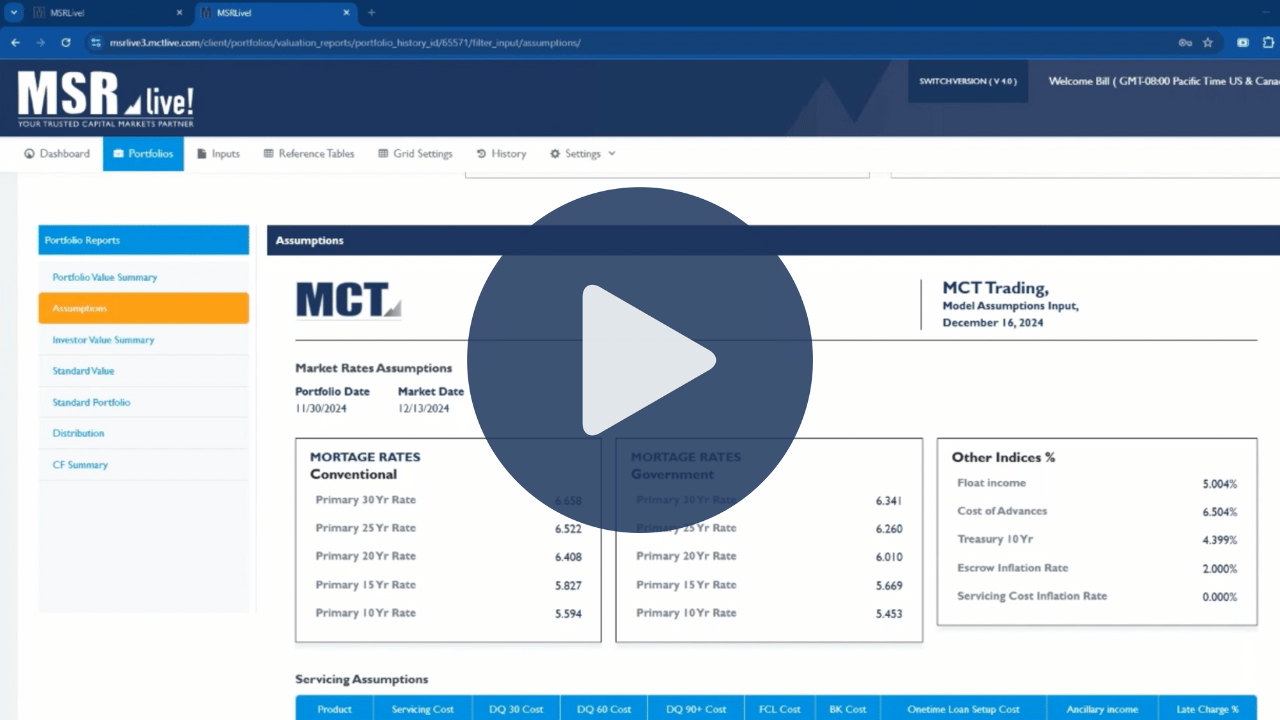
This overview helps users understand the fundamental drivers behind their portfolio valuations such as:
Market Indicators:
- Primary mortgage rates for conventional and government products
- 10-year Treasury rates
- Float income rates
- Cost of advances
- Escrow and inflation rates
Portfolio-Specific Parameters:
- Servicing costs
- Incremental delinquency costs
- Ancillary income metrics
- Late charge parameters
- Setup costs
- Cost structure variations
- Program-specific parameters
Investor Remittance Analysis:
- Remittance type by investor
- Investor-specific discount rates
- Advance requirements and timelines
- Payment flow or float days
- Float period calculations
- Ginnie Mae-specific considerations
- Advance obligations
- Interest loss calculations
- Servicer responsibility metrics
The assumptions tab is a tool for understanding the variables that affect MSR valuations. By presenting these critical factors in a unified view, users can better assess the impact of each variable on their portfolio’s performance and make more informed decisions about their servicing strategies.
This consolidated approach is particularly valuable when analyzing advance obligations for programs like Ginnie Mae, where servicers must understand and account for potential interest losses due to payment advancement requirements. The clear presentation of these variables helps servicers anticipate and plan for such obligations while maintaining accurate portfolio valuations.
Investor Value Summary
The investor value summary report provides a granular breakdown of your MSR portfolio by agency or investor, enabling precise performance tracking across different segments of your servicing rights.
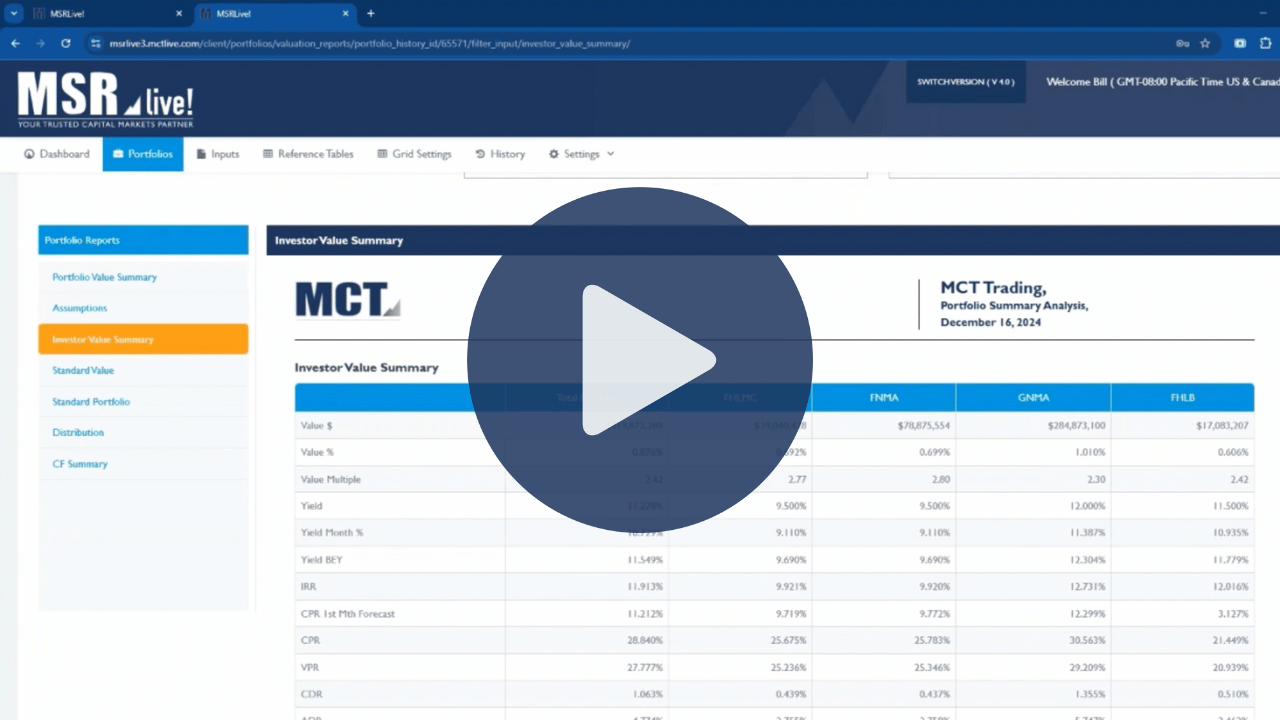
Agency-Level Analytics:
- Segmented performance metrics by investor (Fannie Mae, Freddie Mac, Ginnie Mae, etc.)
- Agency-specific valuation insights
- Comparative analysis across investor categories
Public Reporting Support:
- SEC-ready performance metrics
- Investor-specific data formatted for financial disclosures
- Streamlined extraction of regulatory reporting information
Investor Metrics:
- Agency-specific value drivers
- Segmented cash flow projections
- Investor-level risk metrics
This report eliminates the need to manually aggregate data from detailed portfolio results, providing immediate access to investor-segmented analytics. For publicly traded MSR holders, the Investor Value Summary delivers ready-to-use data for quarterly reports, investor presentations, and regulatory filings.
The report has been designed with inputs from clients who manage complex, multi-investor portfolios. By consolidating critical agency-specific information in a single view, users can quickly identify performance variations across different investor categories and make informed decisions about their servicing strategy for each segment of their portfolio.
Standard Valuation Report
The standard value report provides a framework for MSR portfolio analysis, balancing standardized reporting with filters to meet diverse reporting needs.

Core Standardized Metrics:
- Agency-specific performance indicators
- Investor remittance groupings
- Product type segmentation
- Loan type and asset class breakdowns
- Geographic (state-level) analysis
Reporting Capabilities:
- Expandable metric selection including CDR (Constant Default Rate), duration, convexity, and average life
- Flexible grouping options beyond standard categories
- User-defined report structures
Multi-Dimensional Analysis:
- Segmentation by agency (Fannie Mae, Freddie Mac, Ginnie Mae)
- Categorization by loan characteristics (30-year, 25-year, 20-year, 15-year, 10-year fixed)
- ARM-specific analysis (7/1 ARMs, 5/1 ARMs)
- Geographic performance tracking
This report serves as the foundation for internal reporting while providing the flexibility to adapt to specific organizational needs. The pre-configured format delivers immediate value with commonly requested metrics organized in a logical structure.
This balanced approach makes the Standard Value report particularly valuable for organizations with established reporting protocols that need consistent metrics while maintaining the ability to adapt to evolving analysis needs.
Standard Portfolio
The standard portfolio report provides an in-depth examination of underlying loan characteristics, offering crucial insights into the fundamental composition and health of MSR Portfolio.
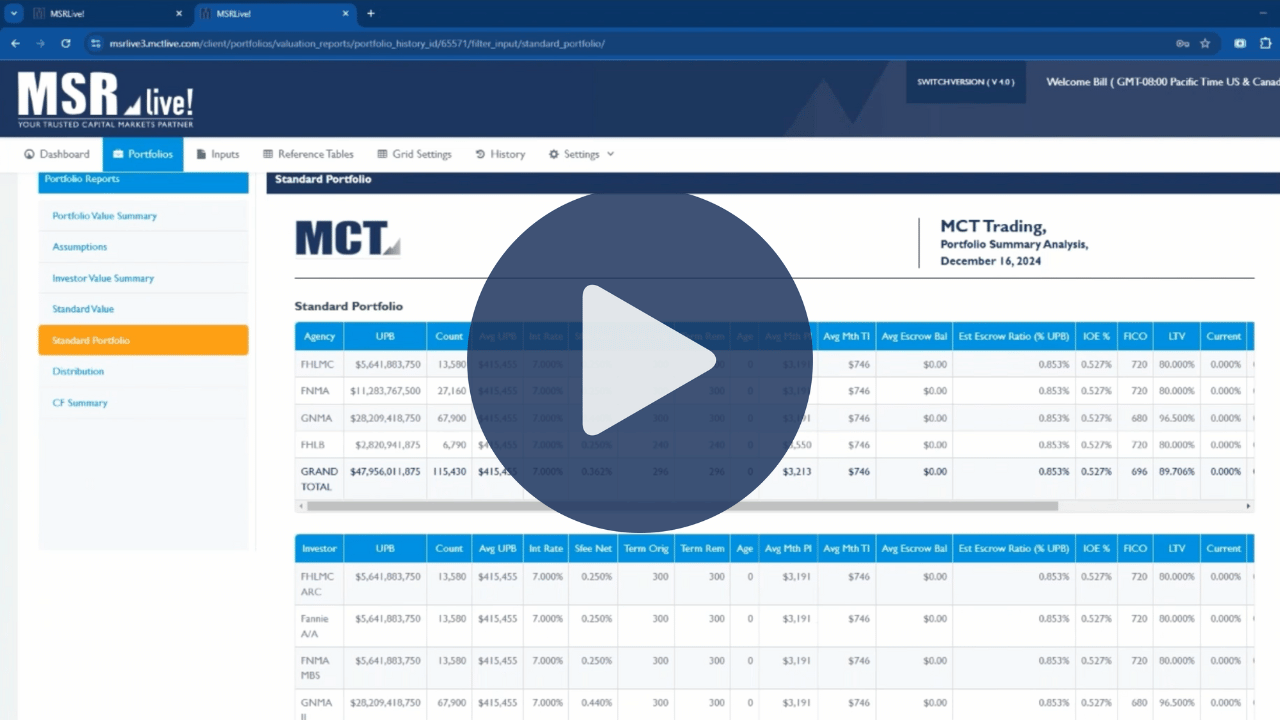
This report moves beyond valuation metrics to examine the underlying loan attributes that drive MSR performance such as:
Loan Characteristic Analytics:
- Original term distributions
- Portfolio age metrics
- Average monthly principal and interest (P&I) payment analysis
- Tax and insurance payment tracking
- Average escrow balance monitoring
- Credit quality indicators (FICO scores)
- Collateral metrics (LTV ratios)
Delinquency Status Breakdown:
- Current loan percentage
- 30-day delinquency metrics
- 60-day delinquency metrics
- Serious delinquency categorization
- Comprehensive servicing status analytics
Portfolio Health Indicators:
- Credit quality trend identification
- Payment performance patterns
- Escrow adequacy assessment
- Risk concentration analysis
This granular view of portfolio composition complements valuation-focused reports, providing the context to interpret value fluctuations and forecast potential performance shifts based on underlying loan characteristics.
Distribution Report
The distribution report transforms portfolio data into clear concentration analytics, revealing the composition patterns that drive MSR performance and risk profiles.
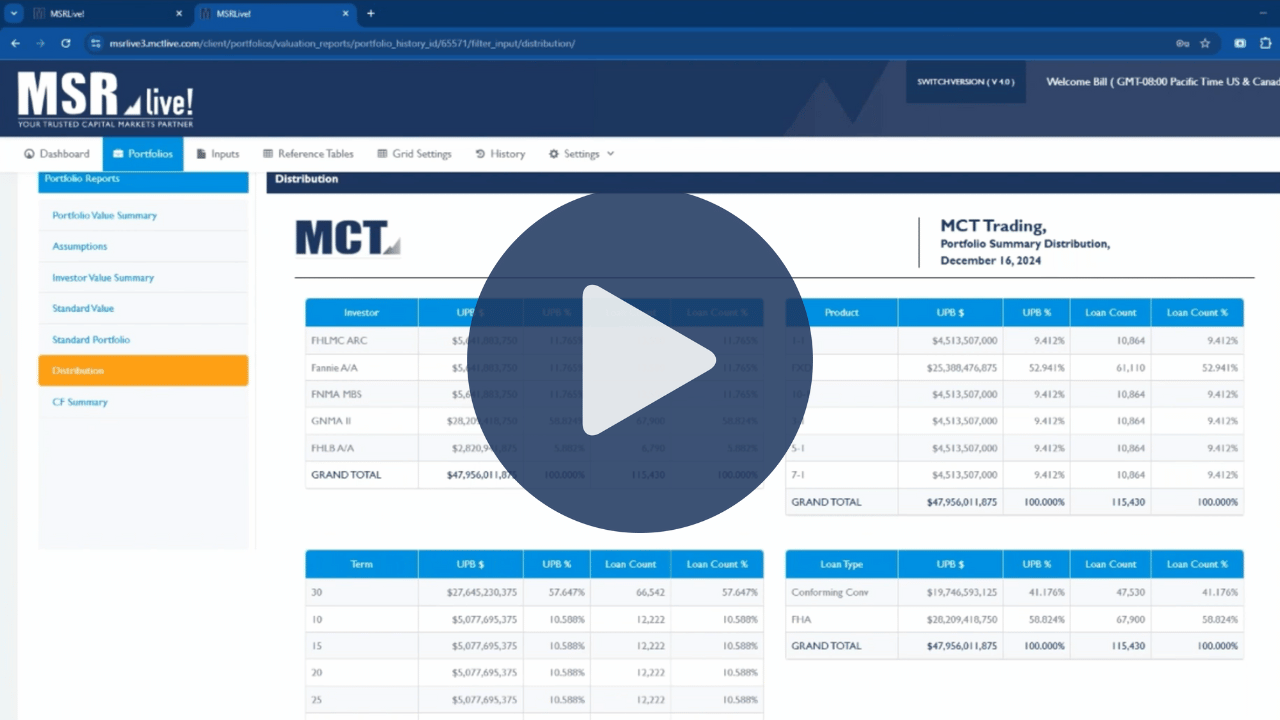
By visualizing key concentration metrics, servicers gain immediate insights into how their MSR assets are distributed across various categories and can identify potential risk factors or strategic opportunities.
Concentration Metrics:
- Investor distribution breakdowns
- Product type concentration analysis
- Term segmentation (30-year, 15-year mortgage percentages)
- Loan type composition (FHA, VA, conventional)
Multi-Dimensional Segmentation Options:
- Geographic (state-level) concentration
- Credit quality (FICO score) distribution
- Collateral risk (LTV) stratification
- Loan purpose categorization
- Property type analysis
Strategic Insights:
- Portfolio diversification assessment
- Risk concentration identification
- Market exposure evaluation
- Servicing strategy alignment
The ability to view concentration analyses across multiple dimensions makes this report particularly valuable for portfolio managers who need to examine different risk factors. Whether tracking geographic exposure, credit quality distribution, or product type concentrations, the distribution report delivers clear, actionable insights into the structural composition of MSR assets.
Cash Flow (CF) Summary
The cash flow summary stands as the cornerstone of effective MSR valuation analysis, providing projected financial revenue streams that drive portfolio value.
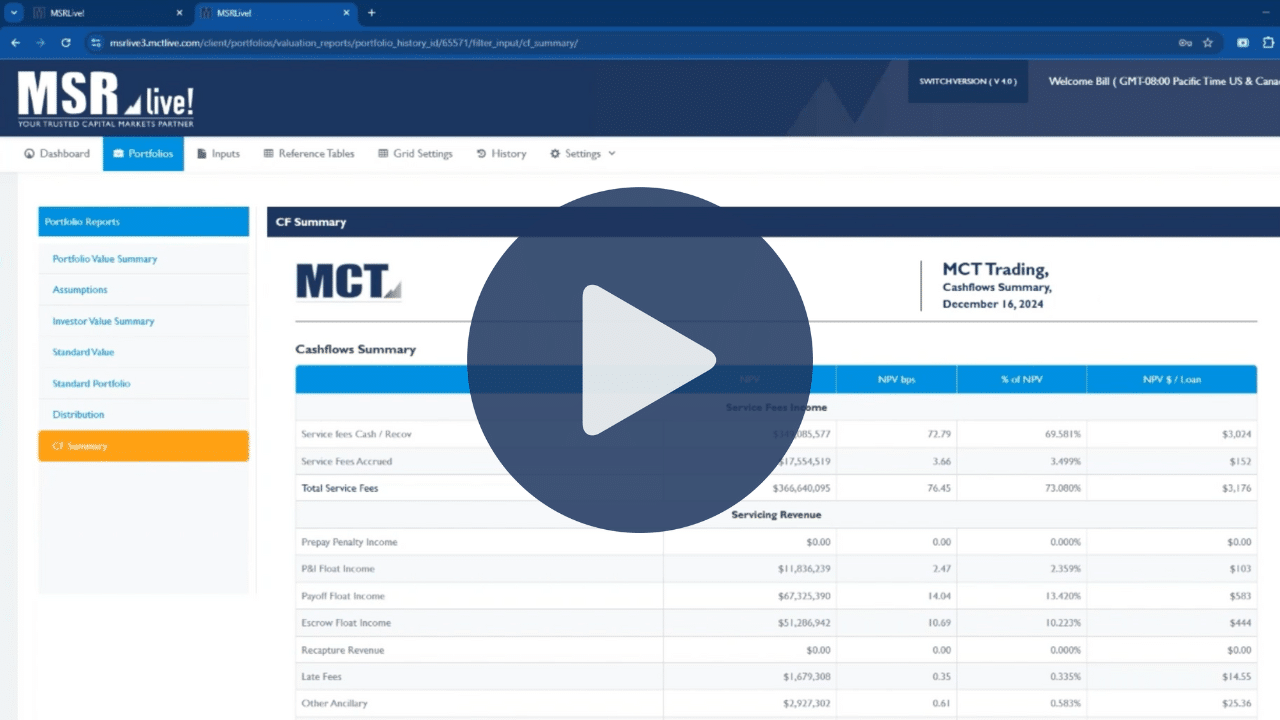
This report transforms complex monthly projections into an intuitive diagnostic framework that validates the integrity of your MSR portfolio valuation. By presenting dozens of variables in a structured format, this report enables analysts to quickly identify projection anomalies and trace them to their source.
What makes this report particularly valuable is its ability to serve as both a validation tool and a troubleshooting guide. When unexpected valuation changes occur, analysts can immediately compare current projections against historical patterns to pinpoint specific cash flow components driving the variance. This targeted approach eliminates the need for reviews of all valuation inputs and focuses the attention specifically on potential problem areas.
Financial Flow Visualization:
- Monthly cash flow projections
- Income stream categorization
- Expense pattern analysis
- Net revenue forecasting
Anomaly Detection Framework:
- Benchmark comparison capabilities
- Historical pattern analysis
- Reasonable range indicators for key metrics
- Escrow float income (typical range: 10-20 basis points)
- Late charges and ancillary income
- T&I advances (normal range: 2-6 basis points)
Validation Tools:
- Month-to-month comparison tracking
- Assumption impact analysis
- Input error identification
- Projection reasonableness assessment
For ongoing portfolio management, the CF summary provides visibility into how changing market conditions, portfolio characteristics, and valuation assumptions interact to affect projected revenue streams. This broad insight is crucial for anticipating value shifts, validating model outputs, and ensuring accurate financial reporting.
As a best practice, MSR analysts should review this report before finalizing any valuation to ensure projection integrity, comparing key metrics against industry benchmarks and reasonable ranges to identify potential errors or misalignments that could impact overall portfolio valuation.
Explore the New Detailed Result Tab
The detailed result tab delivers granular loan-level data that powers deeper MSR portfolio analysis beyond the summary reports. This tab exports the underlying data points for each loan in your portfolio, allowing you to conduct custom analyses in external tools like Excel or database platforms.
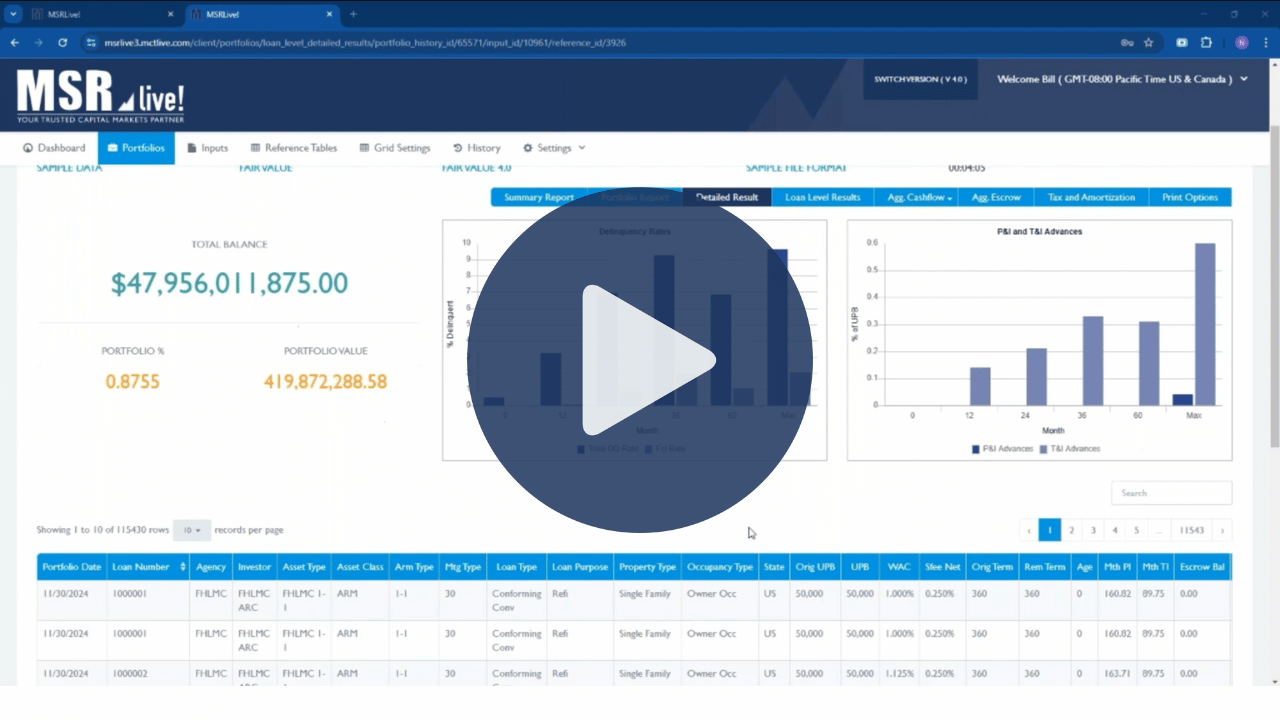
The loan-level detail enables precise trend identification over time, revealing patterns that summary reports might obscure. By tracking individual loan performance month-over-month, portfolio managers can detect subtle shifts in behavior that impact overall valuation and make more targeted servicing decisions.
MCT uses this granular data internally to develop trend analyses that guide client-specific asset management strategies and objectives. The ability to examine each loan’s performance metrics separately provides a foundation for advanced portfolio segmentation, risk assessment, and value optimization.
For asset managers seeking to move beyond aggregated insights, this tab offers the raw data needed to build custom reports, conduct “what-if” scenarios, and identify micro-trends within specific portfolio segments. The exportable format ensures compatibility with your existing analysis tools while maintaining the detailed metrics needed for thorough portfolio management.
The Future of MSRlive! 4.0
MSRlive! 4.0 marks a significant advancement in MSR portfolio management through its enhanced reporting capabilities. The platform now delivers deeper insights through two key innovations: the Portfolio Reports tab and the Detailed Results tab.
MCT continues developing MSRlive! toward a business intelligence platform that will help clients track and manage MSR assets on monthly or quarterly cycles. By providing increasingly sophisticated tools, MCT aims to support clients in achieving both their internal portfolio management goals and external reporting requirements.
Contact Our Team to Learn More
Interested in learning more about MSRlive! 4.0? Contact us for a one-on-one consultation with an MSR expert.