
Treasury yields rebounded last week, although the market paradoxically rallied on Friday despite a relatively strong employment report. The 10-year note ended the week yielding 1.584%, about a 7.5 basis point week/week increase. The yield on the 2-year rose by almost 9 basis points, leaving the 2-10 year spread about a basis point flatter, while the 3mo/10-year spread widened by about 7.5 basis points.
*The MBS Weekly Market Profile Report corresponds to the commentary below.*
MBS had a fairly strong week relative to Treasuries, with the major current coupon spreads over Treasuries narrowing by about 6 basis points. Most coupon swaps expanded, consistent with a rising rate environment, although the Ginnie II 3/2.5 swap managed to contract by a tick. One noteworthy development was the spike in the Fannie 4 Feb/March roll. That roll, which was modestly negative the prior week, moved sharply higher on Thursday and Friday to close at almost 8/32nds, or 5/32nds special. (The accompanying chart shows an intra-day price chart from Bloomberg for Thursday and Friday’s activity.)
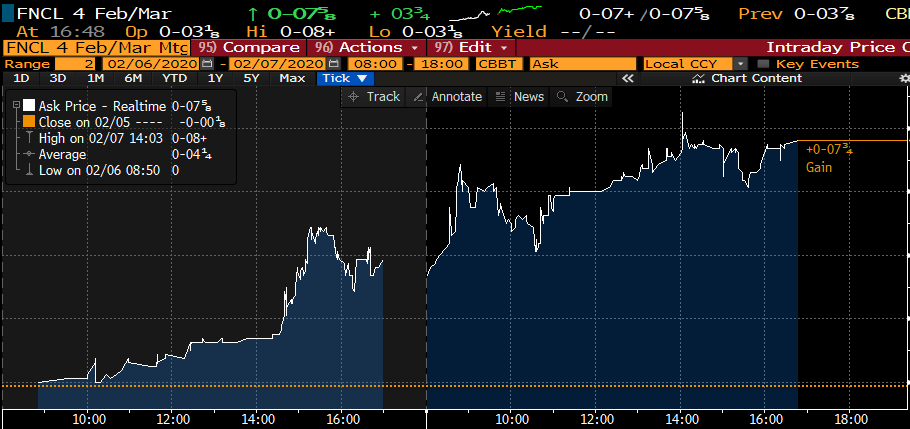
The price action almost certainly reflected technical factors; the March/April roll remains slightly negative, and the changes in the roll’s price reflected outsized increases in the front month’s price. (There were rumors of a big buyer of the Fannie 4 butterfly, i.e. buying Fannie 4s and selling 3.5s and 4.5s.).
While the spike in the Fannie 4 roll reminds us that any coupon can be subject to a technically-driven squeeze, the likelihood is greater for coupons that don’t have a reasonable history of trading activity or significant tradeable float. In the current market both the conventional and Ginnie 2.5% coupons come to mind; traders often question whether there is sufficient liquidity to use this coupon as either an investment or hedging vehicle. Neither coupon was actively traded prior to last summer’s rally, when trading volumes in conventional 2.5s picked up. (“Conventional” includes UMBS TBAs and pools as well as legacy Fannie Mae and Freddie Gold pools.) The chart below gives some insight into recent activity in the coupons.
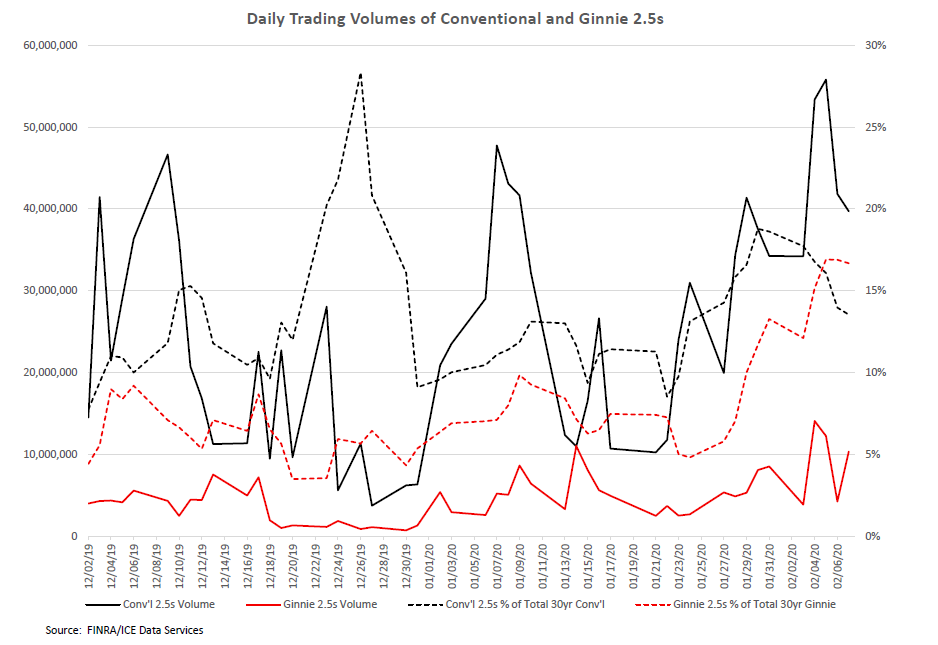
The solid lines show daily trading volumes (in thousands) for conventional and Ginnie 2.5s (referenced on the left axis), while the dotted lines show activity as a percentage of total volumes in the sector, reflected on the right axis. (Put differently, the black dotted line shows the percentage of conventional 2.5s to total 30-year conventional trading; the red dotted line indicates Ginnie 2.5s as a percentage of total 30-year Ginnie activity.) The chart suggests that Ginnie 2.5 trading volumes (and share of volumes) have only recently picked up to the point where they appear to be sufficient to quell fears of squeezes and technical disruptions. (Issuance data from eMBS shows that about $27.2 billion in Ginnie II 2.5s have been issued since August, roughly half of the $52.6 billion in conventional 2.5s issued over the same period.) One other development that offers some comfort is that the Fed recently bought Ginnie II 2.5s for the first time since 2013, which indicates that their managers think the coupon is here to stay, at least in the current rate environment. (They have been buying conventional 2.5s since early September.)
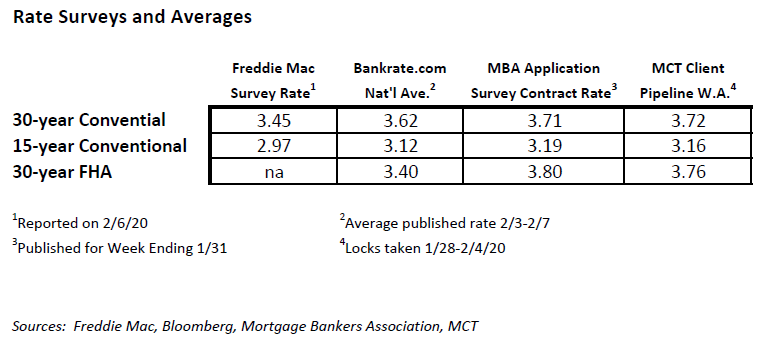
Mortgage rates have bottomed out in the latest rally, with most indices at their lowest levels since the post-Brexit trough in the summer of 2016. The recent decline in rates was reflected in the MBA’s refi application index, which printed last week (for the week ending 1/31) at 2975, its highest level since mid-2013. However, since the various indices and averages quoted for mortgages products vary significantly, the actual levels of “mortgage rates” are not clear.
To attempt to clarify the issue, we compared rates for 30- and 15-year conventional loan and (where applicable) 30-year FHA loans, using values from Freddie Mac’s weekly survey, Bankrate.com’s national average rate (averaged over five days), the MBA’s Application Survey for the week ending 1/31, and MCT’s client pipelines, showing the weighted average rate for locks taken between 1/28 and 2/4. The data, as shown in the table below, suggest that while the Freddie survey rate is relatively low, the MBA’s average contract rate (i.e., the rate actually taken, without adjusting for points) is fairly close to the weighted average rates for recent locks contained in MCT’s client pipelines, and thus is probably the best indicator of the true level of mortgage rates in the current environment.
About the Author: Bill Berliner
As Director of Analytics, Bill Berliner is tasked with developing new products and services, enhancing existing solutions, and helping to expand MCT’s footprint as the preeminent industry-leader in secondary marketing capabilities for lenders.
Mr. Berliner boasts more than 30 years of experience in a variety of areas within secondary marketing. He is a seasoned financial professional with extensive knowledge working with fixed income trading and structuring, research and analysis, risk management, and esoteric asset valuation.
Mr. Berliner has also written extensively on mortgages, MBS, and the capital markets. He is the co-author, with Frank Fabozzi and Anand Bhattacharya, of Mortgage-Backed Securities: Products, Structuring, and Analytical Techniques, which was named one of the top ten finance texts in 2007 by RiskBooks. He wrote and edited chapters for The Handbook of Mortgage-Backed Securities, The Handbook of Fixed-Income Securities, Securities Finance, and The Encyclopedia of Financial Models. In addition, Mr. Berliner co-authored papers published in The Journal of Structured Finance and American Securitization. He also wrote the monthly “In My View” column for Asset Securitization Report from 2008-2012.

