MBS Weekly Market Commentary Week Ending 1/31/20

Treasury yields plunged last week amid fears that the fast-spreading coronavirus would disrupt global trade and economic activity. With U.S. equities off by about 2.5%, the 10-year yield dropped by almost 18 basis points to end the week at 1.508%, breaching its early October lows and getting within 5 basis points of the late-summer trough. While yields for coupon-paying securities declined pretty much in unison, Treasury bill rates actually rose slightly, leaving the 3mo/10-year spread slightly inverted even though the 2/10-year spread closed roughly unchanged. Despite the Fed’s fairly neutral statement after their Open Markets Committee meeting on the 29th, the Fed Funds futures market is currently projecting a 25 basis point rate cut by as early as the June or July meetings, and two easings by the end of 2020.

*The MBS Weekly Market Profile Report corresponds to the commentary below.*

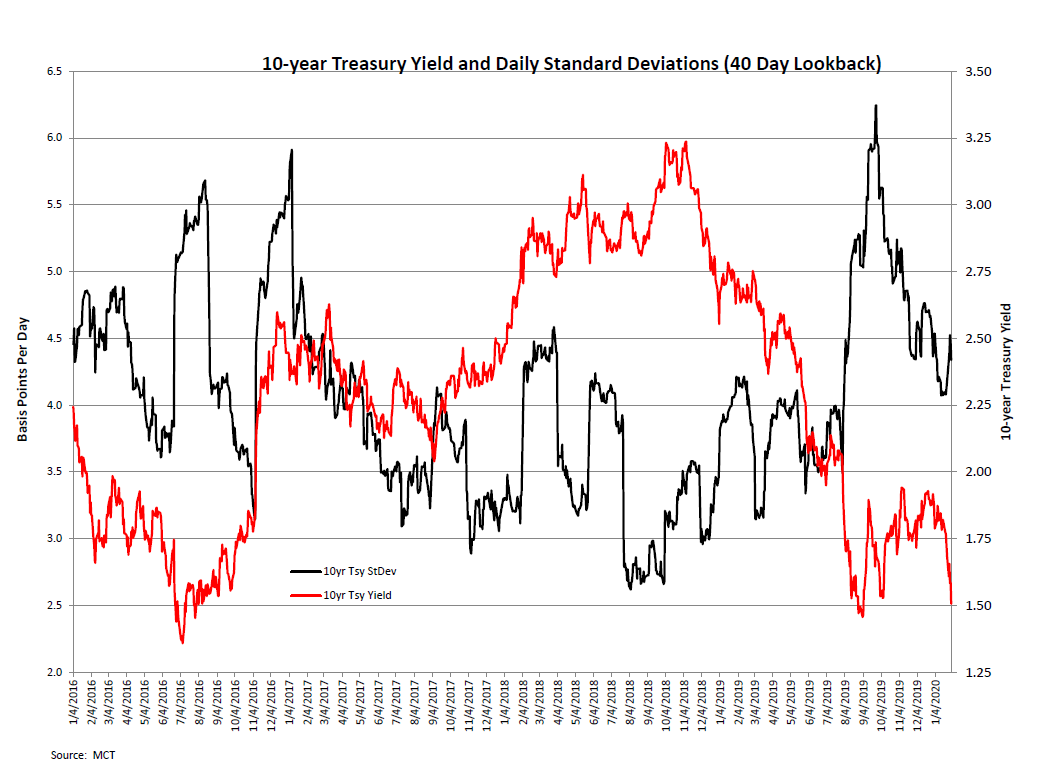
A look at the TIPS market gives some further insights into last week’s rally. While the 10-year TIPS breakeven rate (i.e., the spread between the cash and TIPS yields, and a proxy for expected inflation) declined by about 4 basis points, the TIPS yield itself (a surrogate for “real” long-term rates) dropped by 13.5 basis points to yield -0.133%, its first sub-0% print since late August. This suggests that the rally has been driven by expectations for slower long-term growth and capital costs and is not a reflection of sharply declining inflation fears. The rally also abruptly ended the trend of declining realized volatility. The chart below indicates that the 40-day standard deviation of daily yield changes, which had been dropping steadily since late September, bottomed out in the middle of January and has since increased by about ½ basis point per day.

MBS have struggled amid the drop in rates and uptick in volatility. The 30-year conventional current coupon spread over Treasuries widened by about 8 basis points, while the Ginnie current coupon spread widened by 10 bps. Dollar roll specials have pretty much disappeared, with only the Ginnie II 3% rolls trading a tick or more better than their economic levels. Coupon swaps also contracted, highlighted by the UM30 and GNII 3/2.5 swaps declining by 7-8 ticks. While the weakness in coupon swaps is typical in a rally, an interesting development was the decline in Ginnie/UM swaps, which narrowed by 5-8 ticks. (Also notable was the inversion of the GNII/UM30 3.5 swap, which dropped a quarter-point to end the week at -4/32s.)

A notable development in the rally was the decline in MBS durations and hedge ratios resulting from faster expected prepayment speeds. This is a textbook representation of “negative convexity,” which reflects the rate of change of duration, which in turn is the rate of change in a bond’s price given some change in yield. (If you view duration as akin to “speed,” convexity is equivalent to “acceleration.”) The accompanying table shows the hedge ratios to the 10-year Treasury calculated from Bloomberg’s model for every Friday in January for UM30 liquid coupons, and indicates that the 10-year hedge ratios for UM30 2.5s and 3s declined by 10% and 8%, respectively.

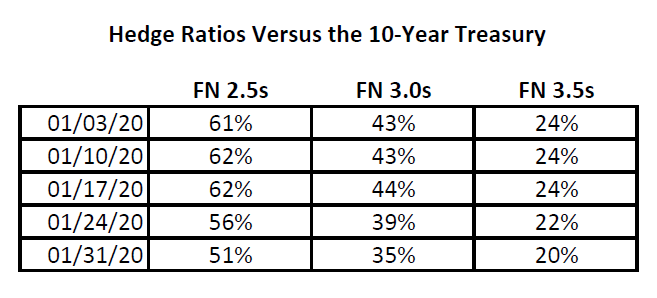
The figures illustrate the challenges of managing and hedging a portfolio containing mortgages and/or MBS. In addition, they highlight how declining MBS durations in a rally can trigger more buying by portfolio managers looking to maintain portfolio durations, putting additional downward pressure on rates.

About the Author: Bill Berliner

As Director of Analytics, Bill Berliner is tasked with developing new products and services, enhancing existing solutions, and helping to expand MCT’s footprint as the preeminent industry-leader in secondary marketing capabilities for lenders.

Mr. Berliner boasts more than 30 years of experience in a variety of areas within secondary marketing. He is a seasoned financial professional with extensive knowledge working with fixed income trading and structuring, research and analysis, risk management, and esoteric asset valuation.

Mr. Berliner has also written extensively on mortgages, MBS, and the capital markets. He is the co-author, with Frank Fabozzi and Anand Bhattacharya, of Mortgage-Backed Securities: Products, Structuring, and Analytical Techniques, which was named one of the top ten finance texts in 2007 by RiskBooks. He wrote and edited chapters for The Handbook of Mortgage-Backed Securities, The Handbook of Fixed-Income Securities, Securities Finance, and The Encyclopedia of Financial Models. In addition, Mr. Berliner co-authored papers published in The Journal of Structured Finance and American Securitization. He also wrote the monthly “In My View” column for Asset Securitization Report from 2008-2012.

10-Year Treasury Yield Curve

Compare this chart with the mortgage rates chart to see how the 10-year treasury and mortgage rates are correlated. Read more below to learn how mortgage rates are tied to the 10 year treasury yield. View raw data on U.S. Department of the Treasury website.


Mortgage Rates Today

The current MBS daily rates are shown below in this chart for 5/1 Yr ARM, Jumbo 30 Yr, FHA 30 Yr, 15 Yr Fixed, 30 Yr Fixed. Sign up for our MBS Market Commentary to receive daily mortgage news in your inbox.

About the Author

Robbie Chrisman, Head of Content, MCT

Robbie started his mortgage industry career with internships during high school and college at Peoples National Bank in Colorado, and RPM & Bay Equity in the San Francisco Bay Area. After graduating from The University of Texas at Austin with a degree in Finance in 2014, he went to work at SoFi, where he rose to Director, Capital Markets assisting in the creation of SoFi’s residential mortgage division before leaving to work for TMS in Austin, Texas. From there, he went to work for FinTech startup Riivos in San Francisco and now is the Head of Content at Mortgage Capital Trading (MCT) in San Diego.

 Join Newsletter or Follow MCT on Social Media:

Previous Weekly Market Reviews by Mortgage Capital Trading (MCT)

Sign up for daily mbs market commentary and review previous commentaries by visiting our commentary category page. Join our email list for further MBS market news, subscribe to receive educational articles, whitepapers, relevant updates, and mortgage market commentary. 

MBS Weekly Market Commentary Week Ending 3/31/23

The market reaction went a little “too far, too fast” in regard to the Fed policy pivot. We witnessed the coupon stack (i.e., the price spread between TBA coupons) decompress in more than a trivial manner in a short period. However, the primary mortgage market has been largely reluctant to follow the Treasury rally, and mortgage rates have ultimately not dropped by the same amount as Treasury yields.

MBS Weekly Market Commentary Week Ending 3/24/23

The FOMC raised its benchmark rate by 25 basis points to a new range of 4.75%-5.00% on Wednesday, a middle ground policy move made in the hope of tampering inflation without further harming the banking system. The raise marks the 9th consecutive rate hike since the Fed began hiking in May of last year and brings the target fed funds rate range to the highest level since September 2007. While the central bank’s monetary policy has been aimed at correcting inflation, it has also revealed hidden weaknesses (e.g., entities whose balance sheets relied on low interest rates).

MBS Weekly Market Commentary Week Ending 3/17/23

Next week will reveal the Fed’s resolve on continuing to beat the drum on their aggressive inflation fight. The word until now has been that the central bank will keep hiking interest rates until inflation is under control.

MBS Weekly Market Commentary Week Ending 3/10/23

Events this week likely will lead to a higher peak interest rate than investors had been expecting just weeks ago. Central bankers appear worried about a cycle in which workers seek higher pay to offset inflation’s bite, and in turn trigger more price increases. In fact, inflation remains high because people have jobs and earn enough income to cover stubbornly expensive housing costs. Robust hiring is good for the economy and workers, but elevated pay growth puts added pressure on the Fed to bring down earnings. 

MBS Weekly Market Commentary Week Ending 2/10/23

The week after the jobs report is generally pretty data-light, and this week was no exception. With a dearth of data, market movement hinged on “Fed speak” and consumer sentiment. We saw some volatility return to bond markets as investors built in expectations for a more hawkish Fed. As a reminder, the Fed raised its benchmark rate last week to a range of 4.5% to 4.75%. Let’s run through what we’ve learned in the wake of that decision and a robust U.S. payrolls report that took some wind out of investors’ sails that had hopes for rate cuts by summer.

MBS Weekly Market Commentary Week Ending 2/3/23

As strong as economists may have thought the job market was, it’s even stronger. In addition to headline non-farm payrolls in January (517,000) beating estimates by around 300,000, employment numbers were revised higher for the past two months. Yes, a tight labor market is anathema to any sort of quick stop to the Federal Reserve’s rate hiking cycle, but the growth rate in average hourly earnings is declining, which will be welcome news to Fed Chair Powell and his colleagues. There exists a raging debate among economists over whether we’ll need a sharp rise in unemployment to keep inflation low.